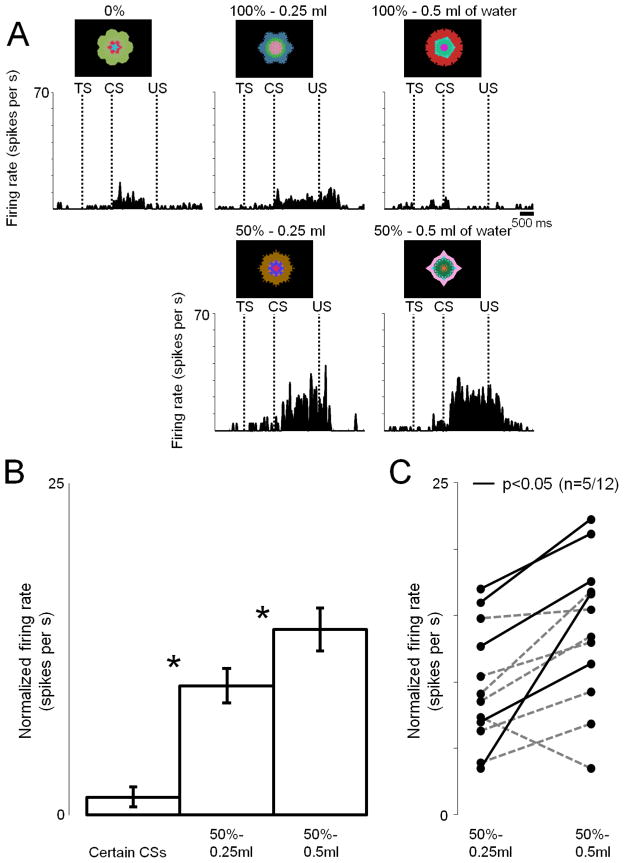
Figure 4. Responses of reward uncertainty neurons to uncertainty about different valued outcomes (Experiment 3).
(A) The activity of a single reward-uncertainty selective neuron (same conventions as in Fig. 3) recorded while monkey Sm experienced 5 reward predicting fractal cues: 100% of 0.5ml, 100% of 0.25ml, 50% of 0.5ml, 50% of 0.25ml, and 0ml of juice. (B) The average CS responses (normalized to baseline) of 12 neurons (7 in Monkey Sm and 5 in Monkey P). Asterisks indicate significant differences (p<0.05; paired signed rank test). Error bars represent standard error (SEM). (C) Uncertain CS responses shown individually for 12 neurons in the probability block (normalized to baseline). Black lines indicate sessions with significant difference (p<0.05; ranksum test).

