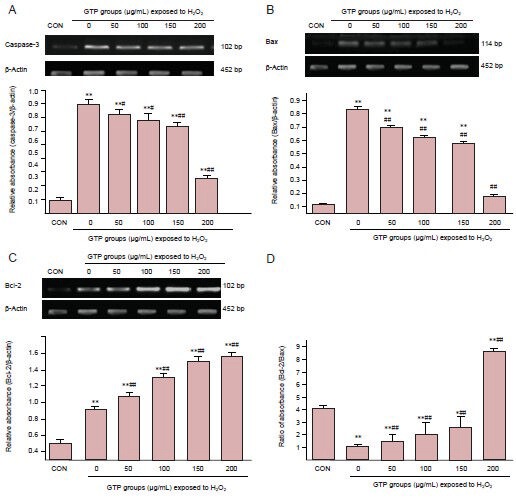
Figure 4.

Expression of the apoptosis-related genes caspase-3 (A), Bax (B) and Bcl-2 (C), and the ratio of Bcl-2/Bax (D), in spinal cord neurons under H2O2-induced oxidative stress, after treatment with 0–200 μg/mL green tea polyphenol (GTP) for 24 hours (Real-time PCR).
Data are expressed as mean ± SD (n = 3). *P < 0.05, **P < 0.01, vs. CON group; #P < 0.05, ##P < 0.01, vs. 0 μg/mL GTP group (one-way analysis of variance and least significant difference test). CON: Normal control; H2O2: hydrogen perioxide.
