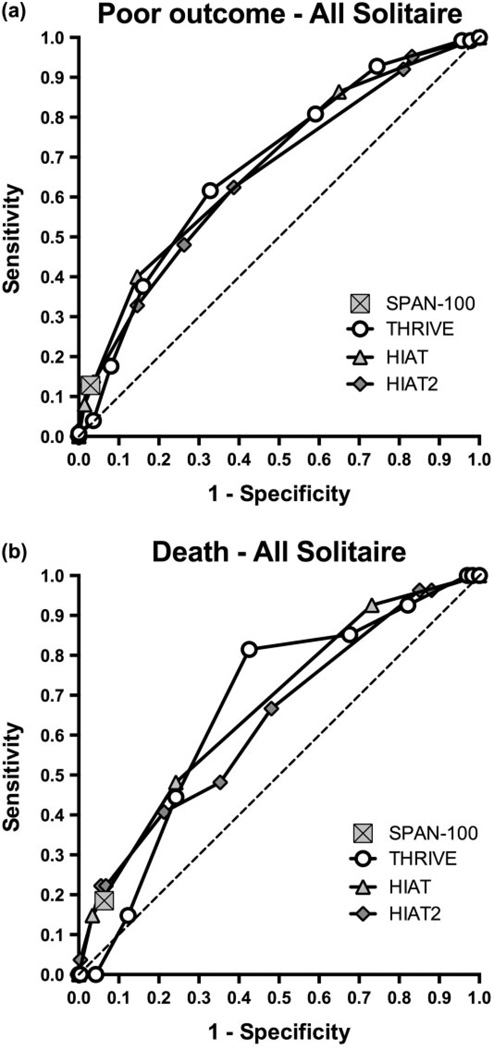
Fig. 3.
Comparison of THRIVE to other outcome prediction scores by receiver–operator characteristics (ROC) curve analysis. (a) ROC curves for score prediction of poor outcome at three-months (mRS 3–6), comparing THRIVE, HIAT, HIAT2, and SPAN-100. SPAN-100 is represented by a single point because it is a dichotomous predictor. (b) ROC curves for score prediction of death by three-months (mRS 0–2), comparing THRIVE, HIAT, HIAT2, and SPAN-100. HIAT, Houston Intra-Arterial Therapy score; mRS, modified Rankin Scale; SPAN, Stroke Prognostication using Age and NIH Stroke Scale score; THRIVE, Totaled Health Risks in Vascular Events.

