Figure 2.

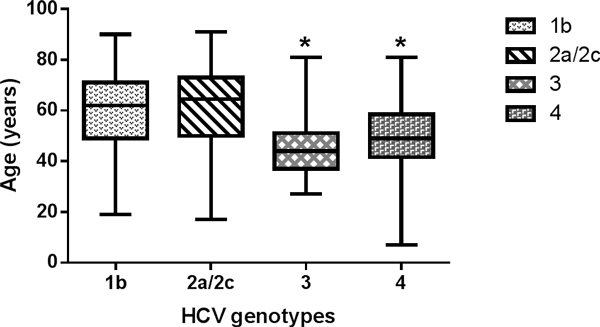
Box plot of genotypes 1b, 2a/2c, 3 and 4 distribution by HCV patients age in the January 2011-August 2013 period. * P < 0.01 versus genotypes 1b and 2a/2c (ANOVA plus Tukey test).

Box plot of genotypes 1b, 2a/2c, 3 and 4 distribution by HCV patients age in the January 2011-August 2013 period. * P < 0.01 versus genotypes 1b and 2a/2c (ANOVA plus Tukey test).