Figure 2.

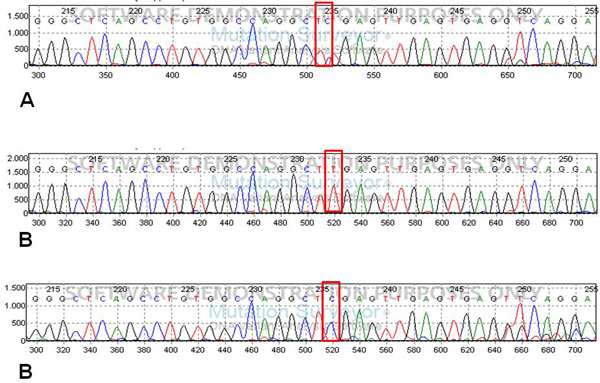
SNP rs153109 direct sequencing. Representative electropherogram of direct sequencing analysis, heterozygote A/G (A) and homozygote A/A e G/G (B). The red rectangles indicate the SNP position.

SNP rs153109 direct sequencing. Representative electropherogram of direct sequencing analysis, heterozygote A/G (A) and homozygote A/A e G/G (B). The red rectangles indicate the SNP position.