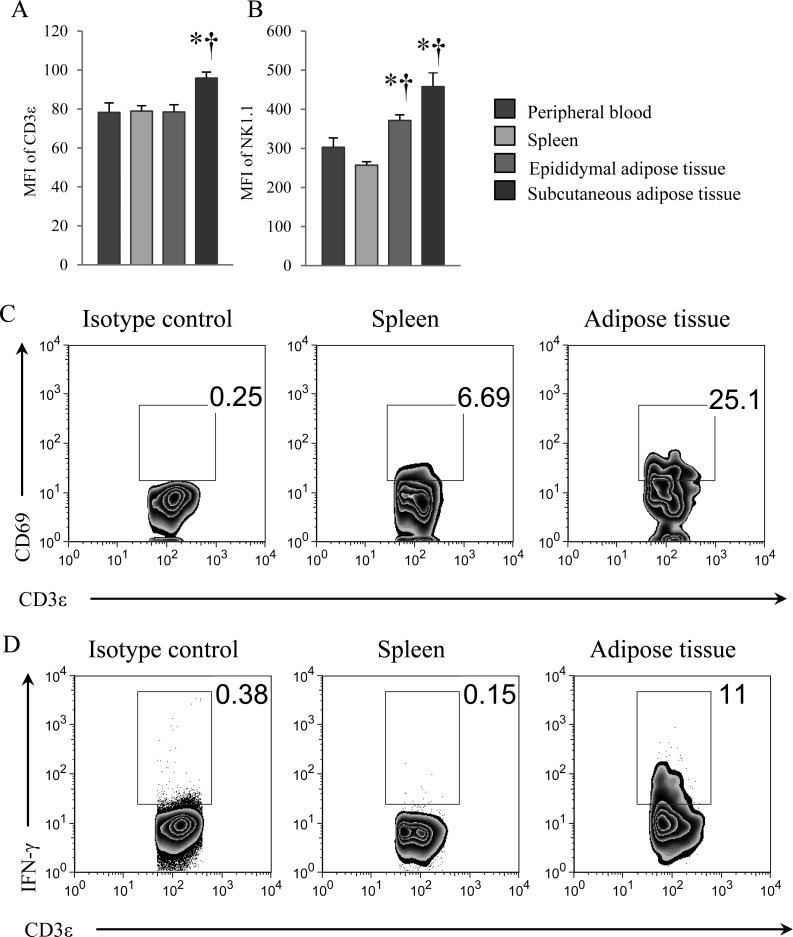
Fig. 3.
Flow cytometric analysis of cell-surface markers and intracellular cytokine of NKT cells. (A) Mean fluorescence intensity (MFI) of CD3ε in NKT cells, and (B) MFI of NK1.1 in NKT cells from peripheral blood, the spleen, and epididymal and subcutaneous adipose tissues. MFI determinations were performed by flow cytometry using 20-week-old mice. (C) Flow cytometric analysis of CD69 expression in NKT cells of spleen and epididymal adipose tissue. (D) Flow cytometric analysis of intracellular IFN-γ in NKT cells of spleen and epididymal adipose tissue. The fraction of NKT cells was gated by CD3ε+ and NK1.1+ cells. Mice were 8 weeks-old. Data represent means ± SEM (n=5).*P<0.05 vs. peripheral blood; †P<0.05 vs. spleen.

