Fig. 5.
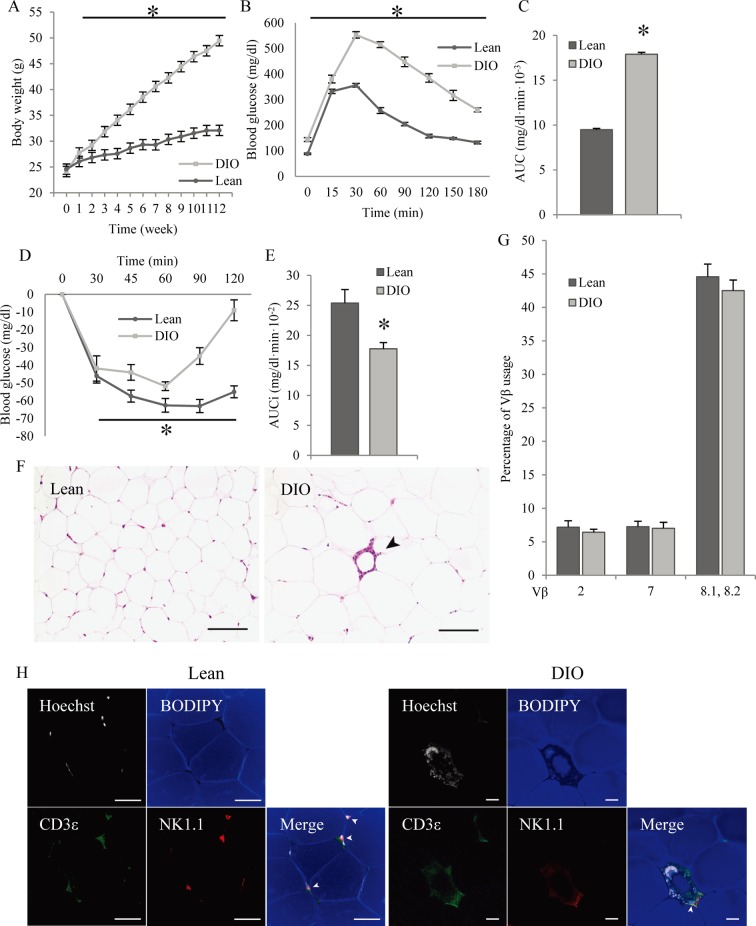
Effects of obesity on NKT subpopulations. Mice were fed a normal diet or a high-fat diet from 8 to 20 weeks-old. (A) Body weight increases over time in lean and DIO mice from 8 to 20 weeks-old (n=6–7). (B) Blood glucose concentration; a glucose-tolerance test was performed after a 16-h fast and intraperitoneal administration of 2 g/kg glucose. Lean and DIO mice were 20 weeks-old, and fed either a normal or high-fat diet for 12 weeks (n=6–7). (C) Calculation of the areas under the curve (AUC) of blood glucose concentrations (Fig. 5B) (n=6–7). (D) Blood glucose concentration; insulin-tolerance test performed after a 16-h fast and intraperitoneal administration of 0.5 IU / kg insulin. Lean and DIO mice were 20 weeks-old and fed either a normal or high-fat diet for 12 weeks (n=6–7). (E) Calculation of the areas under the curve inverse (AUCi) of blood glucose concentrations (Fig. 5D) (n=6–7). (F) Histology of epididymal adipose tissues from 20-week-old lean mice (left) and DIO mice (right). The arrowhead shows a CLS. Bar=100 µm. (G) Proportions of Vβ2-, Vβ7-, Vβ8.1- and Vβ8.2-positive NKT cells in total NKT cells from lean and DIO mice (n=5–6). (H) Three-dimensional adipose tissue imaging of epididymal adipose tissue from 20-week-old lean and DIO mice, performed by confocal microscopy. Nuclei (white), lipid droplets (blue), CD3ε (green), and NK1.1 (red) were counterstained. Arrowheads show NKT cells. White bar=50 µm. All data represent means ± SEM. *P<0.05 vs. lean mice.

