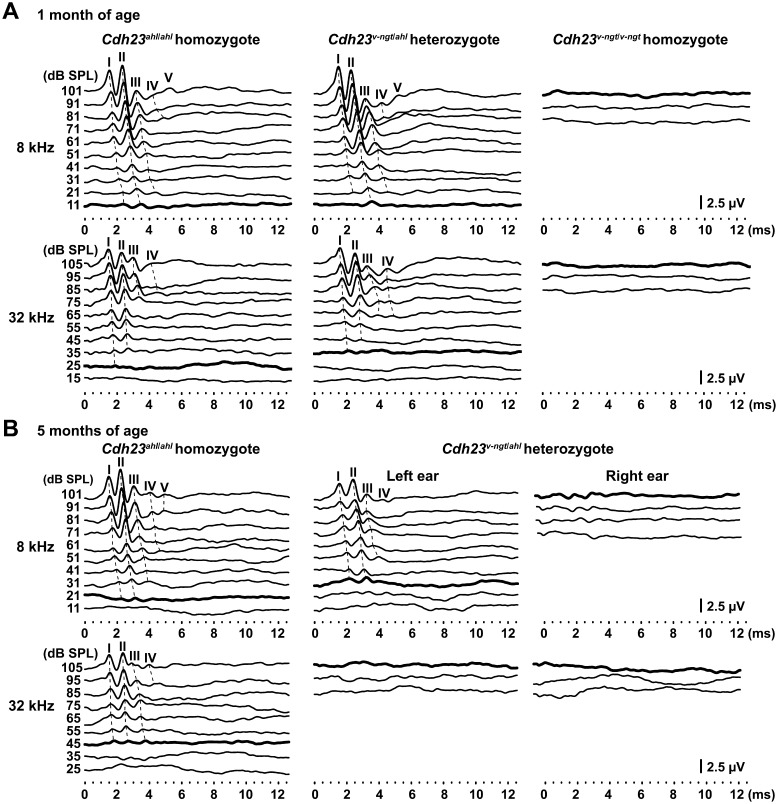
Fig. 4.
ABR waveforms were recorded for hypomorphic Cdh23ahl/ahl homozygous, Cdh23v-ngt/ahl compound heterozygous, and null Cdh23v-ngt/v-ngt homozygote mice. The waveforms represent the ABR in response to the intensities of tone pip stimuli decreasing from 101 to 11 dB SPL at 8 kHz and from 105 to 15 dB SPL at 32 kHz. Bold lines represent the thresholds detected. The locations of peaks I-V are indicated on the dotted lines. (A) Representative ABR waveforms at 8 and 32 kHz from Cdh23ahl/ahl, Cdh23v-ngt/ahl, and Cdh23v-ngt/v-ngt mice at 1 month of age. (B) ABR waveforms at 8 and 32 kHz from Cdh23ahl/ahl and Cdh23v-ngt/ahl mice at 5 months of age. The waveforms of the Cdh23v-ngt/ahl mouse were recorded from the left and right ear of the same mouse.

