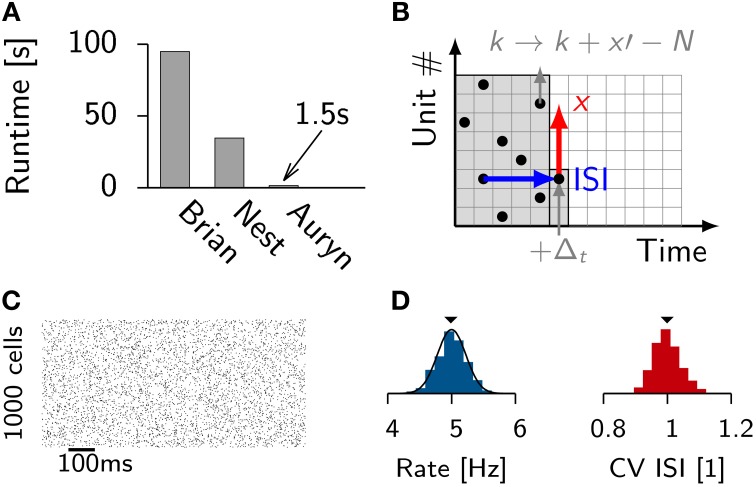
Figure 1.
Efficient generation of Poisson spike trains from a population of input units. (A) Run times of different simulators to generate 100 s long spike trains from 1000 Poisson neurons spiking at 5 Hz. (B) Illustration of the algorithm. One typical ISI interval for single Poisson neuron (blue). Typical example of a random stride of magnitude x (red arrow) or a stride x′ that would lead beyond N and is consequently continued in the next time step (gray). (C) Spike raster from simulated Poisson spike trains from (A). (D) From the same simulation: Distribution of firing rates (left) with the theoretical expectation from the Poisson distribution (solid line). Right: Distribution of coefficient of variation of the ISI (CV ISI). The mean values of the distributions are indicated by arrow heads.

