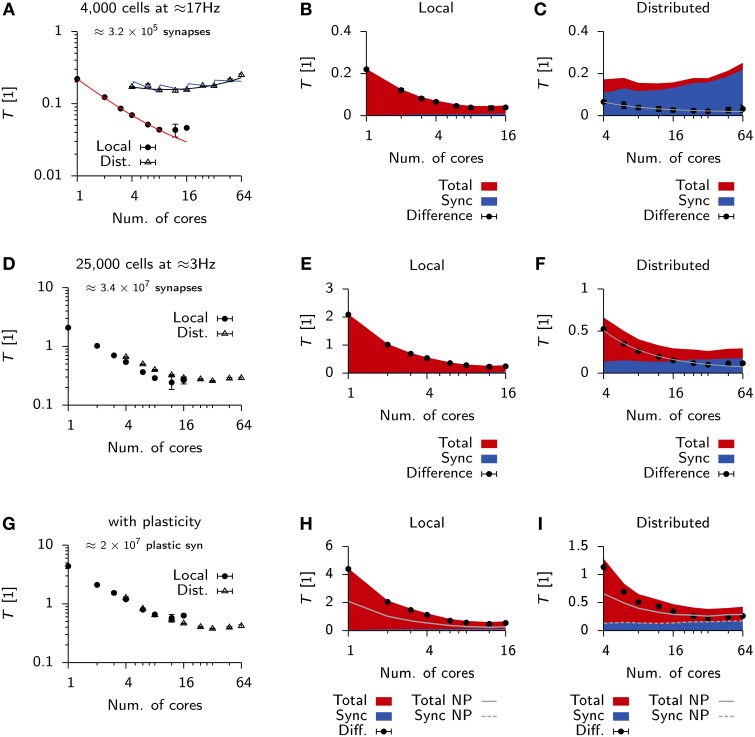
Figure 6.
Scaling behavior in Auryn. (A) Scaling of relative run time in the Vogels-Abbott benchmark on a single machine and when run distributed over four machines. Solid red line: RMS fit of Expression (2) to local run time data. Blue and black lines: RMS fit of Expression (2) and (3) respectively to distributed run time data. Error bars represent the standard deviation of the data. (B) For the same simulation as in (A). Time spent on total computation (red) and the fraction spent on synchronization (blue) for different numbers of cores used locally. Black bullets: Difference between the two. (C) Same as (B), but when run distributed over four machines. Gray line: RMS fit of to difference data points. (D) Scaling of relative run time in the 25 k cell network without plastic synapses on a single machine and when run distributed over four machines. (E,F) Same as (B,C) but for the 25 k cell network from (D). (G–I) Same as before, but for the 25 k cell network with plastic excitatory-to-excitatory synapses. (H,I) Solid gray line: Total from (E,F) for reference. Dashed line: Sync from (E,F) for reference.

