Figure 9.
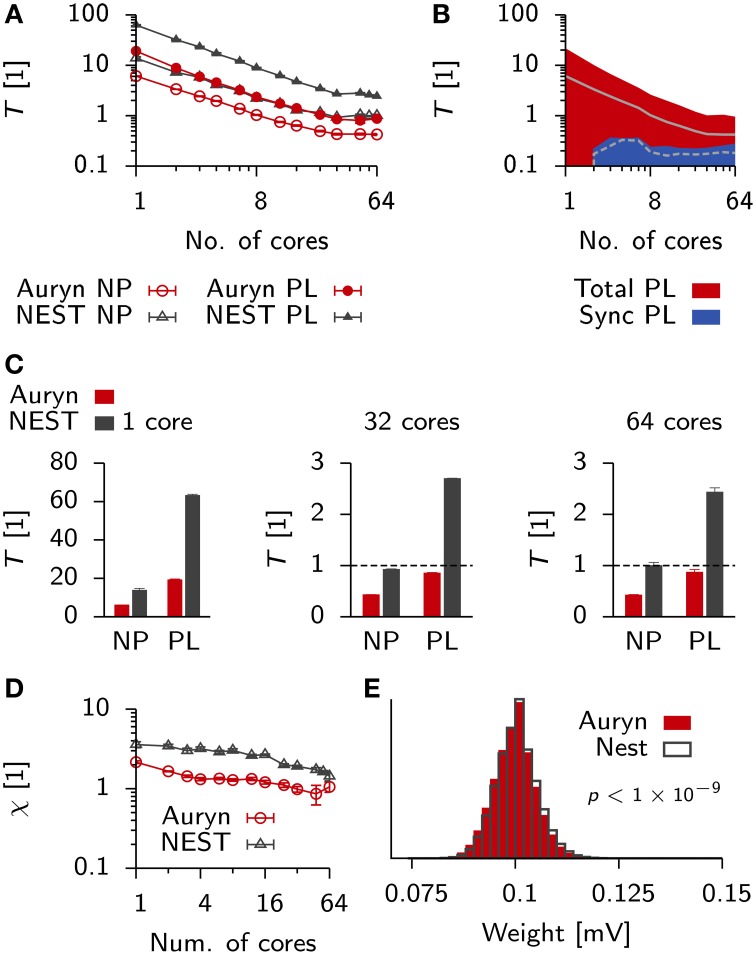
Comparison of run times in balanced networks with plasticity. (A) Scaling behavior of the relative run time T for a classical balanced network model (Brunel, 2000) when simulated in NEST (black) and Auryn (red). The measurement was done for the non-plastic (NP) network and a network with multiplicative STDP (PL). (B) Total run time (red) and time used for synchronization (blue) for the plastic simulation using Auryn. (C) Bar plot of the end point values in (A). Single core (left), 32 cores (middle) and all 64 cores (right). Dashed line: real-time simulation. (D) Relative difference between run time of the plastic and non-plastic network for Auryn (red circles) and NEST (gray triangles). (E) Final weight distribution after 20 s of simulated time for runs with learning rate λ = 1 × 10⁻² using Auryn (red) and NEST (gray). p-value computed from Kolmogorov-Smirnov test comparing the two samples.

