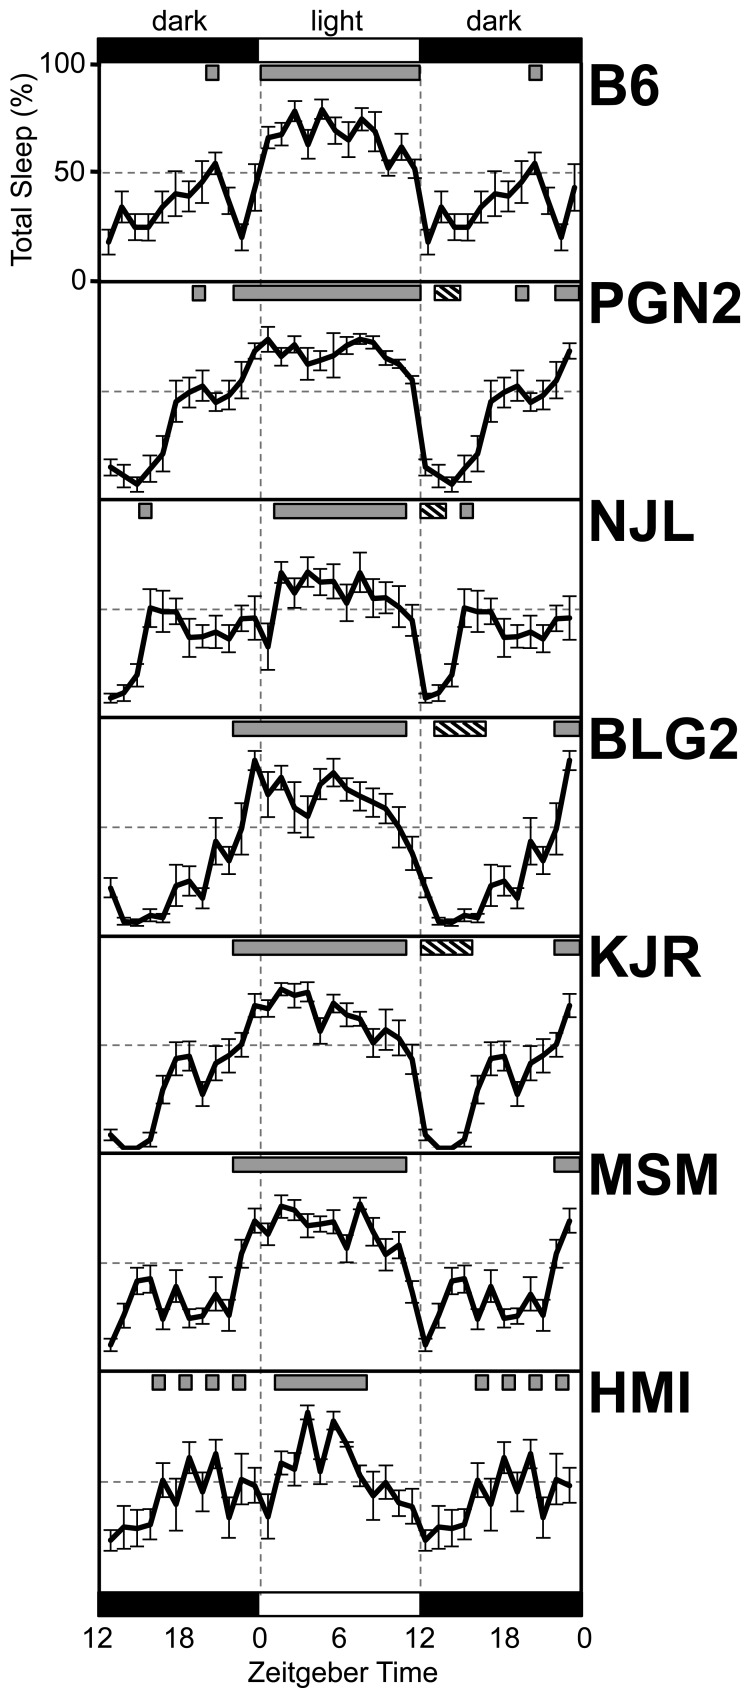
Fig. 1.
Diurnal rhythm of total sleep in seven inbred mouse strains: B6, PGN2, NJL, BLG2, KJR, MSM, and HMI. The prevalence (%) of total sleep is plotted at 1-h intervals. Each data point represents the means ± SE for 8 mice except for the HMI strain (n = 6). The bars at the top and bottom represent the 12-h light (white) and 12-h dark (black) phases, respectively. The values for the 12-h dark phase are duplicated to illustrate the changes at the light–dark transition. Gray bars at the top of each figure represent the period of total sleep >50%. Hatched bars at the top of each figure represent periods of total sleep <10%.

