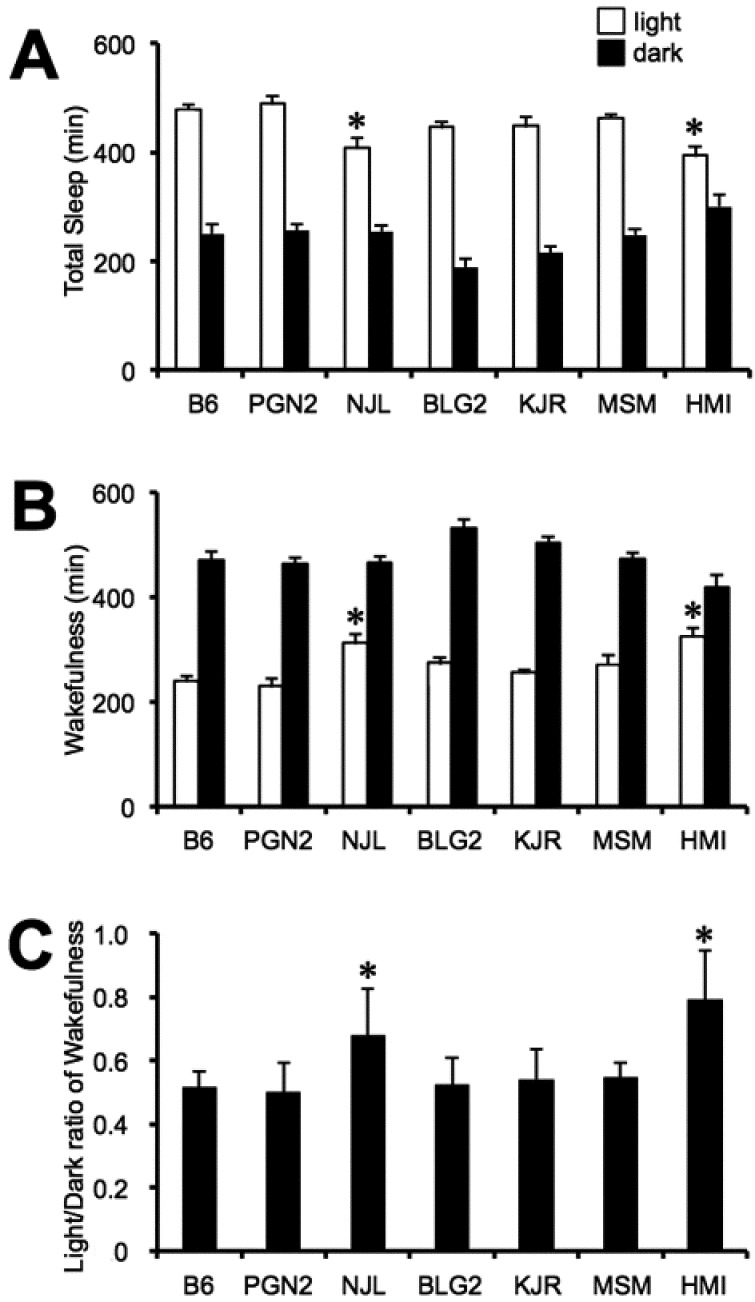
Fig. 2.
A: The amount of total sleep; B: The amount of wakefulness during the 12-h-light (open columns) and 12-h-dark (filled columns) phases. C: Light:dark ratio of wakefulness in seven inbred mouse strains. Values are the means ± SE for 8 mice except for the HMI strain (n = 6). *P < 0.05 compared with the B6 strain.

