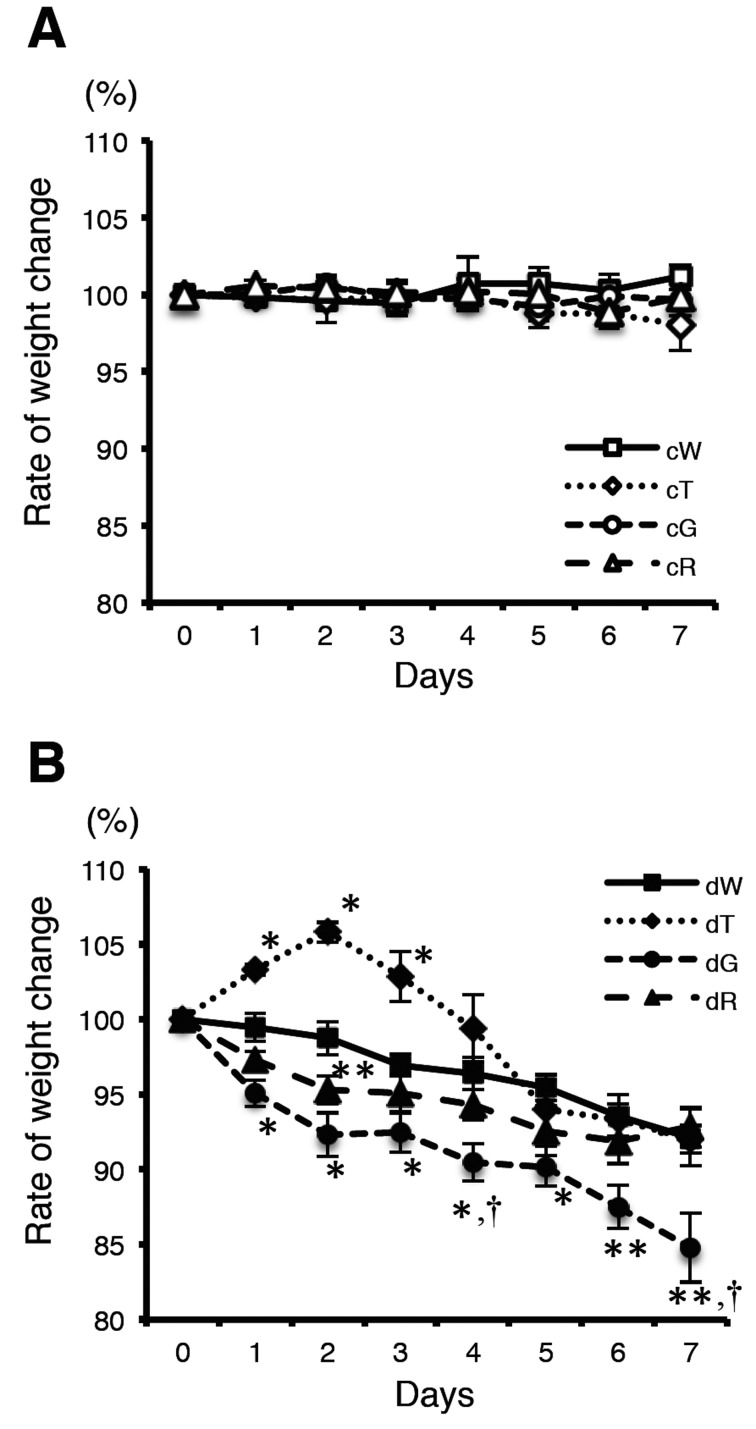
Fig. 1.
Body weight changes of control mice (A) and DSS-treated mice (B). Body weights were measured daily. Mean body weights (% of pretreatment body weight) are shown. c, control. d, DSS treated. W, wild-type mice. T, T-bet Tg mice. G, GATA-3 Tg mice. R, RORγt Tg mice. Data represent means ± SEM (*P<0.01, vs. wild-type mice; **P<0.05, vs. wild-type mice; †P<0.05, vs. T-bet Tg and RORγt Tg mice) (n: cW=7, cT=5, cG=5, cR=7, dW=7, dT=7, dG=7, dR=7).

