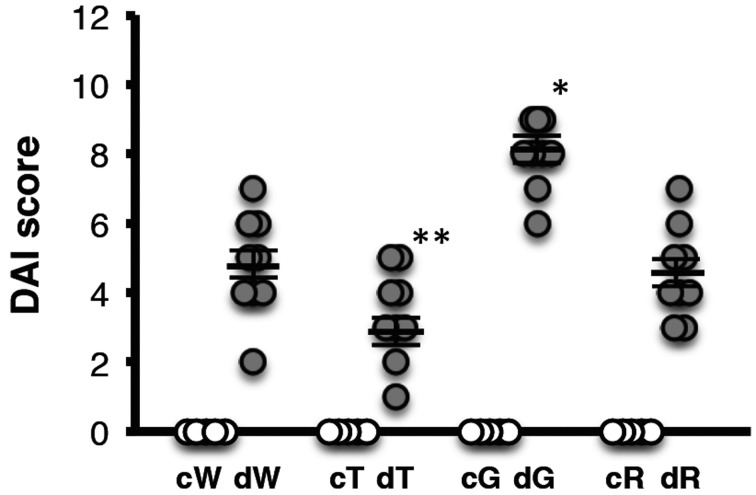
Fig. 2.
DAI scores of control and DSS-treated mice. DAI was quantified based on the scoring system described in Material and Methods. c, control. d, DSS treated. W, wild-type mice. T, T-bet Tg mice. G, GATA-3 Tg mice. R, RORγt Tg mice. Data represent means ± SEM (*P<0.01 vs. dW, dT, and dR; **P<0.01 vs. dW and P<0.05 vs. dR) (n: cW=5, cT=5, cG=5, cR=5, dW=9, dT=9, dG=9, dR=9).

