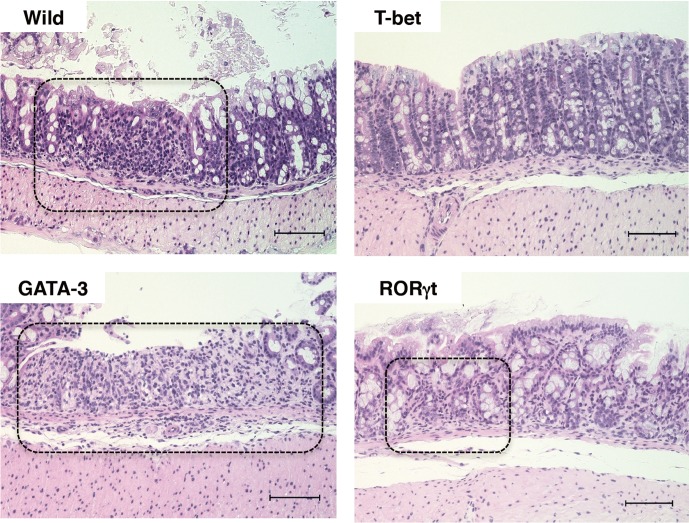
Fig. 3.
Microscopic appearance of intestinal tissues on day 4 of DSS treatment. Microscopic views of H&E-stained colons are shown (magnification ×200, scale bar 100µm). The dot-lines indicate that infiltration of cells (wild mice, GATA-3Tg mice, and RORγt Tg mice) and ulcer sites (wild mice and GATA-3Tg mice).

