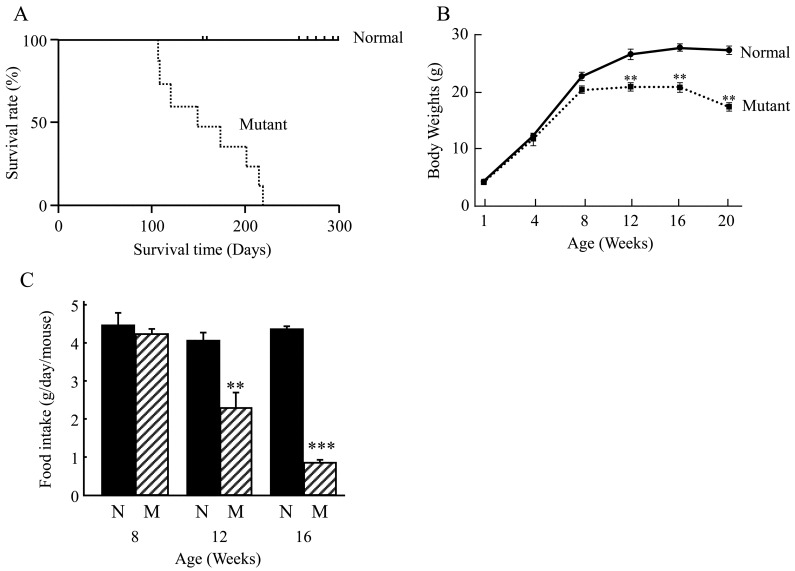
Fig. 1.
Survival rate, body weights and food intake. A: Line graph shows Kaplan-Meier analysis of the probability of survival with age for normal (line) and mutant (dashed line) mice. B: Line graph shows the body weight (grams; g) of normal and mutant mice over a period of 20 weeks. C: Bar graph shows the average food intake in g/day/mouse that was measured at 8, 12 and 16 weeks. N (black bars)=normal; M(cross hatched bars)=mutant. **, P<0.01, ***, P<0.001.

