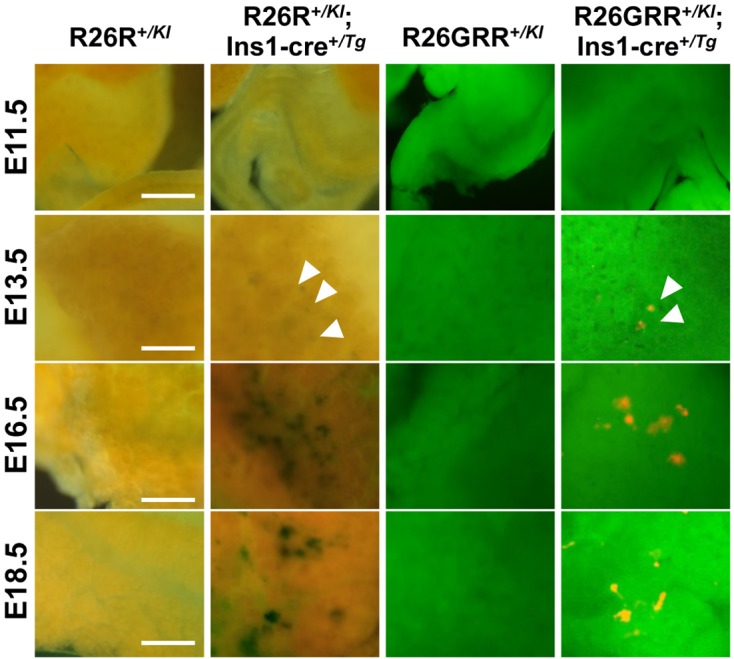
Fig. 5.

Representative stereomicroscopic imaging of the pancreas in F1 mice R26R+/KI, R26R+/KI; Ins1-cre+/Tg, R26GRR+/KI, and R26GRR+/KI; Ins1-cre+/Tg, during embryo development. X-gal staining: R26R+/KI mice and R26R+/KI; Ins1-cre+/Tg mice, EGFP & tdsRed florescence imaging: R26GRR+/KI mice and R26GRR+/KI; Ins1-cre+/Tg mice. Each experiment (average n=4). Sale bar: 500 µm (E11.5) and 100 µm (E13.5–18.5).
