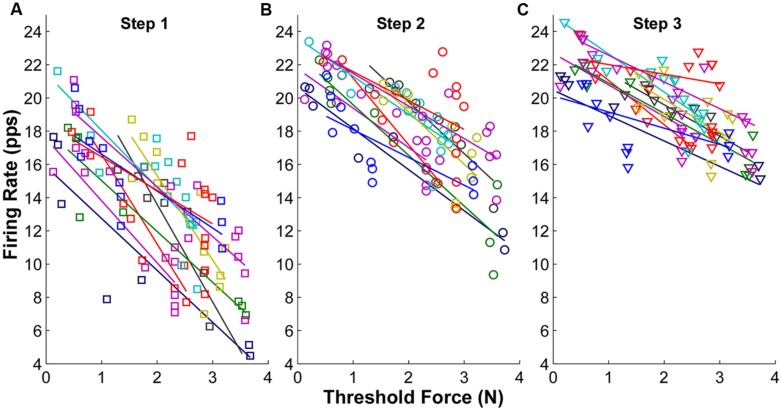
FIGURE 3.
Mean firing rate as a function of threshold force at each step from one exemplar subject. (A) Mean firing rate at step 1. Each symbol represents one motor unit, and different colors represent different trials. The linear regression line was also plotted for each trial. (B) Mean firing rate at step 2. (C) Mean firing rate at step 3.

