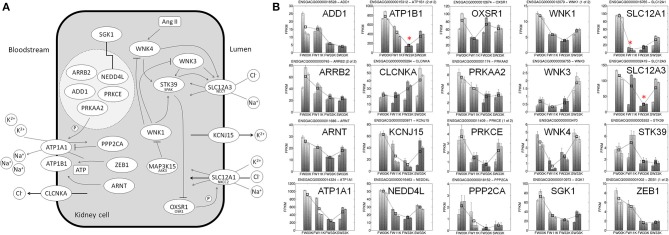
Figure 3.

Expression profiles for stickleback genes in diuretics pathway. (A) Diagrammatic representation of the diuretic pathway. (B) Expression profiles of genes in the diuretic pathway. For each gene, expression levels of the gene under four acclimation treatments, FW00K, FW11K, FW33K, and SW33K, are shown in the bar plots.
