
Figure 2.
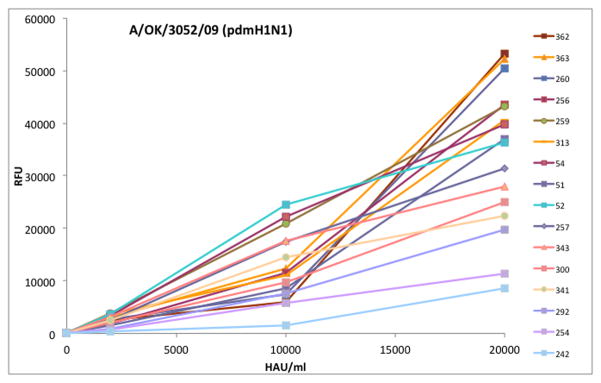
Dose response of influenza virus A/Oklahoma/3052/2009 (pdmH1N1) discriminates high and low affinity binding to the CFG Glycan Array v4.0. The x axis is the concentration of virus applied to the array slide (HAU/ml) and the y axis is the fluorescent signal. Due to different affinities, the order of binding at 20,000 HAU/ml is somewhat different to that at 10,000 HAU/ml, emphasizing the need to screen multiple concentrations of virus. For clarity, some binding glycans are not shown here and neither are the majority of glycans on the array that remain at baseline at all concentrations.