
Table 2.
Comparison of results in Figure 3 with other studies of binding of pandemic H1N1 viruses.
| Material Array platform | Virus CFG (Fig 3) | HA CDC [33] | Virus CFG [5] | HA NHS-glass [19] | Virus Glycolipid [7] | ||
|---|---|---|---|---|---|---|---|
| Glycan | Rank (binding high to low) | ||||||
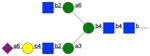
| Structure | CFG v4 ID | CDC ID | OK/3052/09 | Tx/5/09 | Tx/15/09 | Calif/07/09 | Calif/04/09 |
|
|
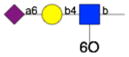
259 | 57 | 1 | 1 | 2 | np1 | np |
|
|
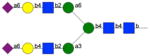
327 | - | 1 | np | 1 | 1 | np |
|
|
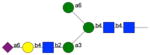
260 | 56 | 3 | 1 | 3 | 2 | 1 (with Glc at posn 5) |
|
256 | 41 | 4 | 4 | 5 | 3 | np |
|
|
257, 258 | 53, 54 | 6 5 |
5, 3 | 4, 6 | 3 | 2 |
|
51, 52, 54, 53 | -. 47, 46, 48 | 7, 8, 9, 12 | 6, 7, 8 | 7 8 |
np | 4 |
|
|
255 | 55 | 10 | 9 | nb2 | np | np |
|
|
325 | - | 11 | np | 18 | np | np |
|
|
343 | - | 13 | np | nb | np | np |
|
341 | - | 14 | np | nb | np | np |
|
314 | 49 | 15 | nb | nb | np | np |
|
315 | 45 | 16 | nb | 11 | np | np |
1
np = not present on the array
2
nb = insignificant binding