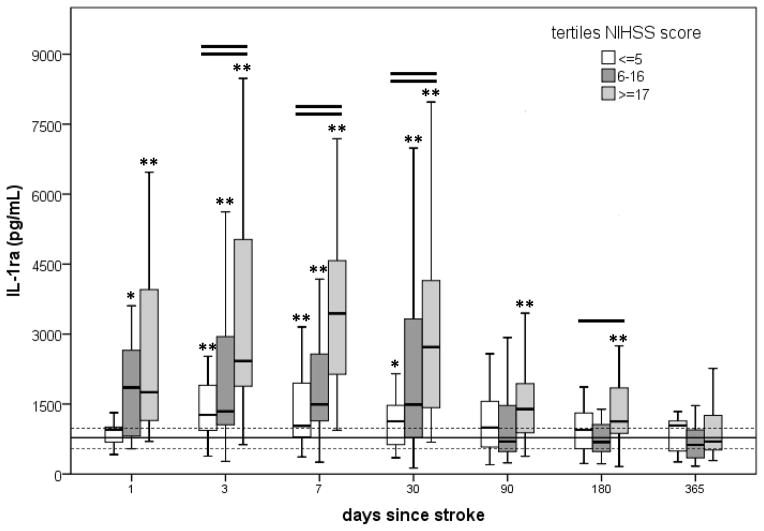
Figure 1.
Changes in plasma IL-1ra over time as a function of stroke severity. Values are depicted as the median and interquartile range. The solid horizontal line represents the median value for the control population, the dashed lines represent the interquartile range. One horizontal line over the box plots at a given time point indicates that the groups differ from each other at P<0.05; two horizontal lines indicates that the groups differ from each other at P<0.01 (Kruskal-Wallis H test). An asterisk (*) indicates that the group differs from controls at P<0.05; ** indicates that the group differs from controls at P<0.01 (Mann-Whitney U test).

