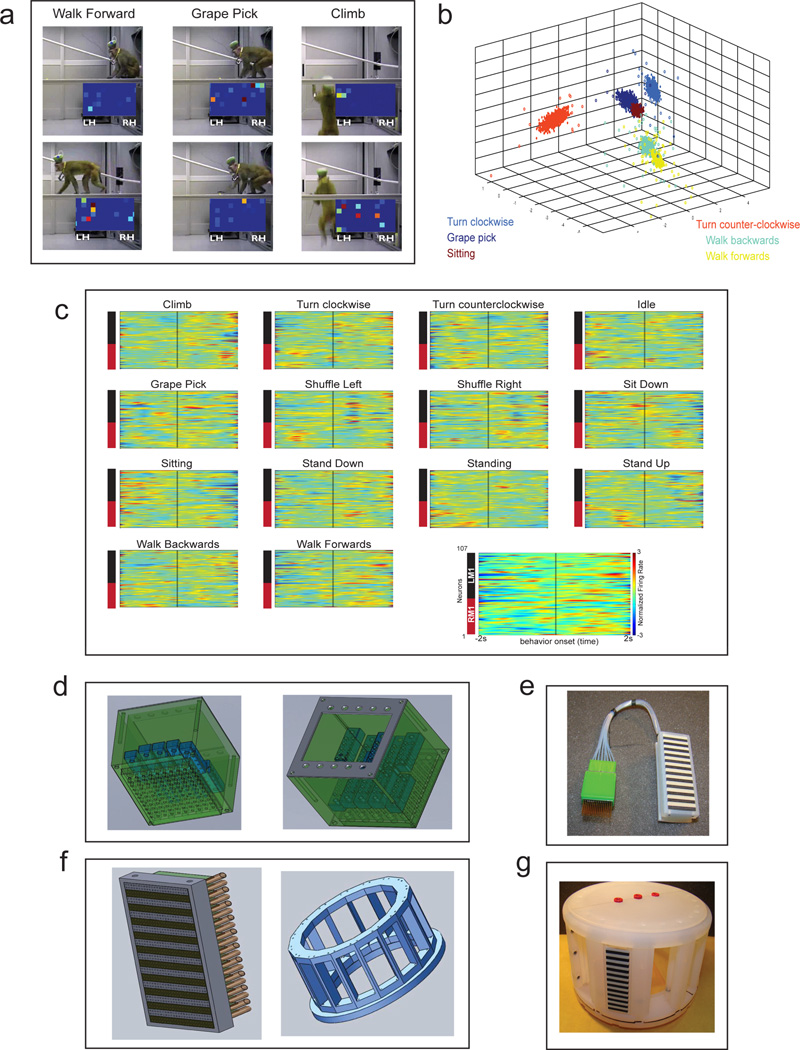
Figure 6. Freely Behaving Recordings and Future Arrays.
(a) Screenshots of videos used for coding of behaviors. Two frames for three sample behaviors are shown. See Supplementary Video 3. (b) Plot of the first three principal components of neural activity for 6 different behaviors, color coded per behavior, shown as filled in circles. PCA data was used for SVM classification (see Table 5). (c) PETHs for behaviors from a single monkey, calculated from 107 M1 neurons centered around behavior onset. Legend for spectrograms placed on the bottom right corner to reduce figure clutter. Each unit was normalized for the entire session (all behaviors shown) using the z-score method. (d) 864 channel array assembly modules. Left panel shows the bottom view with guiding tube density. Right panel shows the top view with a depiction of the movable assemblies. (e) Photograph of fully assembled array with guiding tubes. Note the high density connector attached. (f) Connector and cap design. Left panel shows schematic for high density connectors. Right panel shows a redesign of the cap which should allow for the management of 10,000 channels without increasing the cap footprint. (g) Panel shows photograph of plastic cap mounted with a single connector. The fully assembled cap will host 12 connectors, each with 864 channel capacity.

