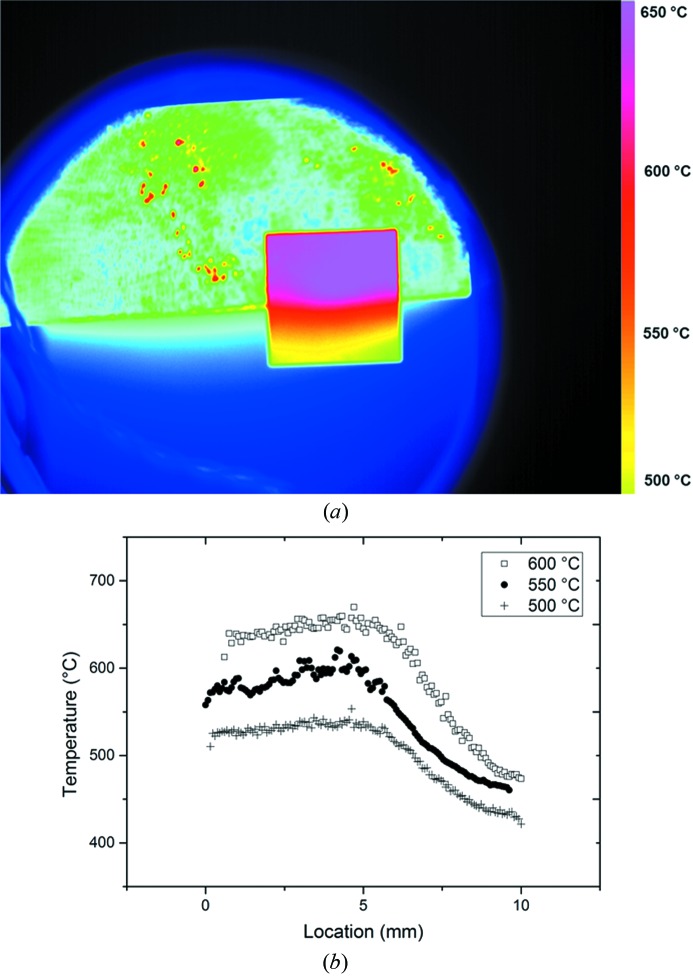
Figure 5.
(a) Direction of the beam and scan shown with an example of a false-colour thermal image highlighting gradients using a 256 shade colour-map. (b) Thermal gradients obtained using infrared thermal imaging at three nominal scan temperatures as a function of location across the sample (from 0 to 10 mm) averaged along the isotherms and during the duration of the scan.

