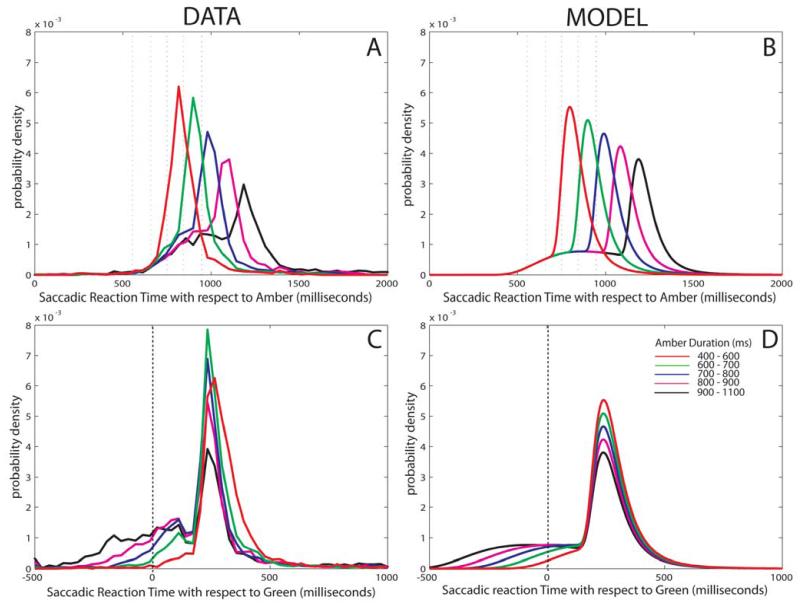
Figure 8.
Saccade distributions as a function of amber duration: data and model findings.
Using maximum likelihood estimation to estimate means and standard deviations for two recinormal distributions, the data (A & C) is well modeled (B & D). Note how the anticipatory component increases with amber duration.

