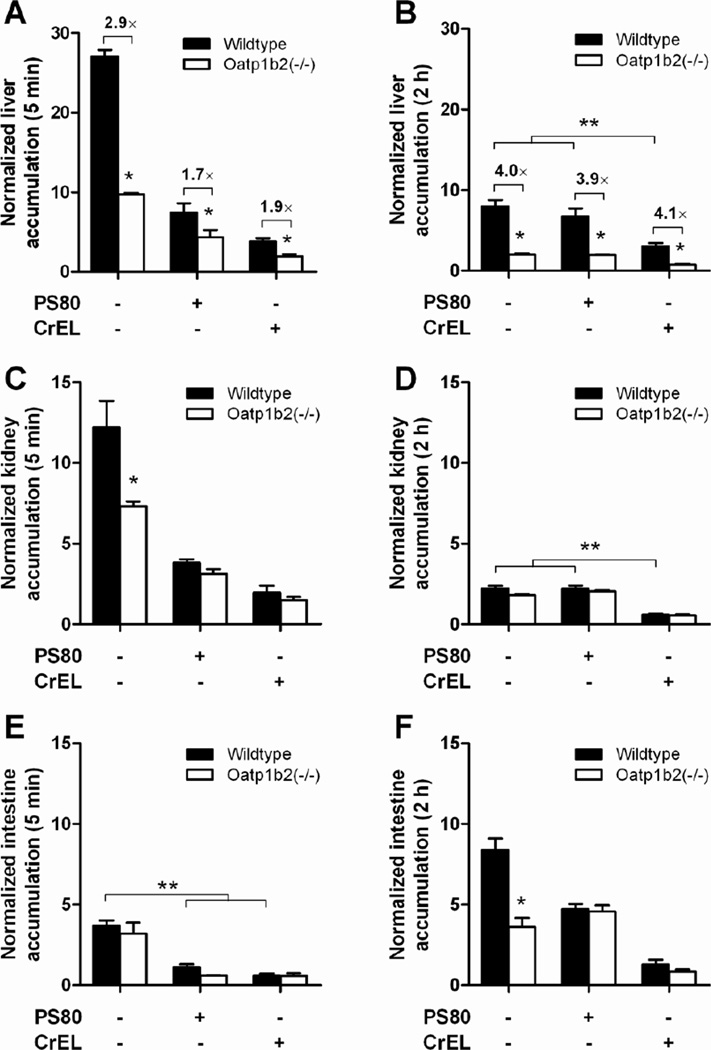
Figure 2.
Influence of paclitaxel formulation and Oatp1b2-deficiency on paclitaxel distribution. Paclitaxel was formulated as nab-paclitaxel in the absence of PS80 or CrEL, in PS80, or in CrEL (see Methods for details), and total paclitaxel levels were determined in wildtype and Oatp1b2(−/−) mice at 5 min and 2 hours after i.v. injection in liver (A–B), kidney (C–D), and intestine (E–F). Tissue levels were normalized to the corresponding plasma concentration (5 min data) or the AUC from time zero to 2 hours (2-hour data). Data are presented as the mean (bars) of 4 observations per condition per time point, along with SD (error bars). The star (*) indicates a statistically significant difference compared to the corresponding wildtype group (P < 0.05), and the double star (**) indicates a statistically significant difference compared to the other formulations (P < 0.05).

