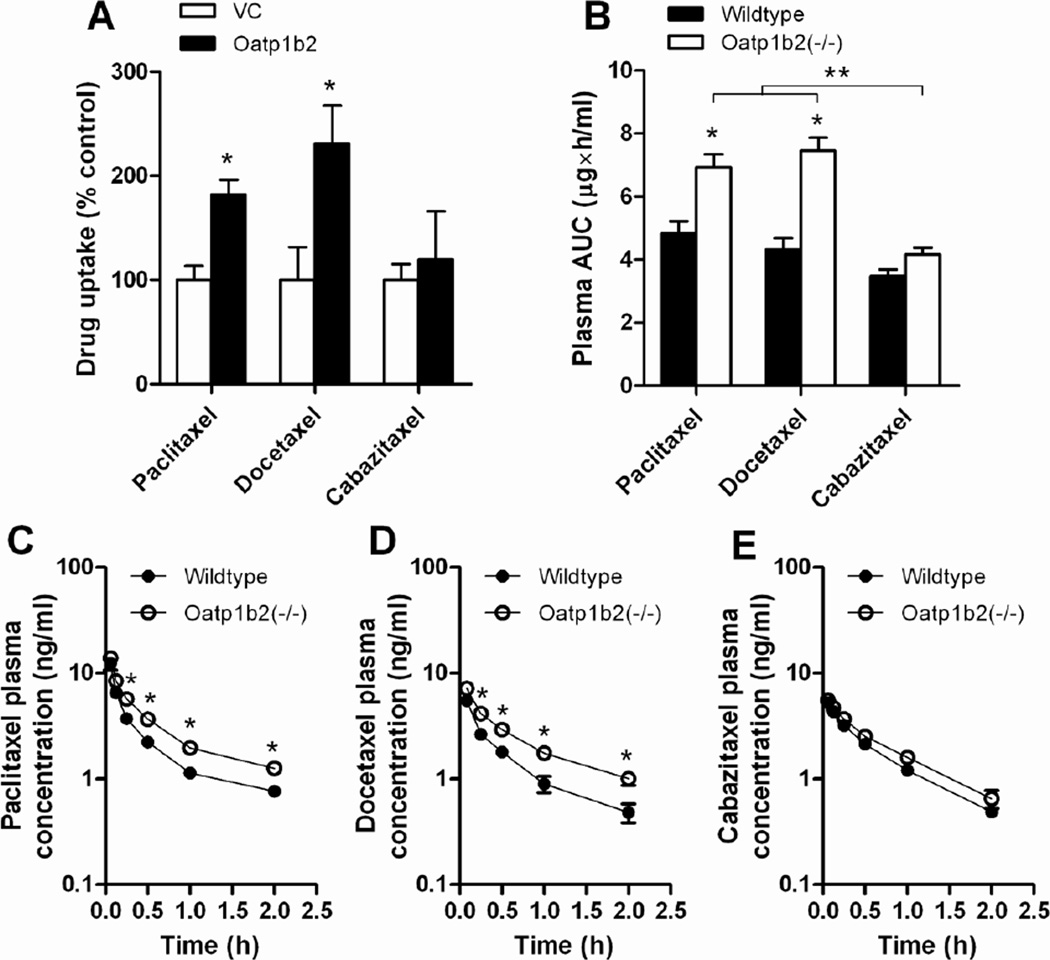
Figure 4.
Comparative effects of formulation and Oatp1b2-deficiency on transport of paclitaxel, docetaxel, and cabazitaxel. (A) The uptake of paclitaxel, docetaxel, and cabazitaxel by mouse Oatp1b2 transfected was evaluated in transfected HEK293 cells (0.1 µM; 15-min). Data are presented as the mean percentage of uptake values in the VC cells (bars) for 4–11 observations per condition, along with SD (error bars). The star (*) indicates a statistically significant difference compared to VC (P < 0.05). (B) Area under the curve (AUC) of paclitaxel in wildtype and Oatp1b2(−/−) mice following administration of paclitaxel, docetaxel, or cabazitaxel, all formulated in PS80 (see Methods for details), along with the corresponding plasma concentration-time profiles for paclitaxel (C), docetaxel (D), and cabazitaxel (E). Data are presented as the mean (bars or symbols) of 4 observations per condition per time point, along with SD (error bars). The star (*) indicates a statistically significant difference compared to the corresponding wildtype group (P < 0.05), and the double star (**) indicates a statistically significant difference compared to the other formulations (P < 0.05).

