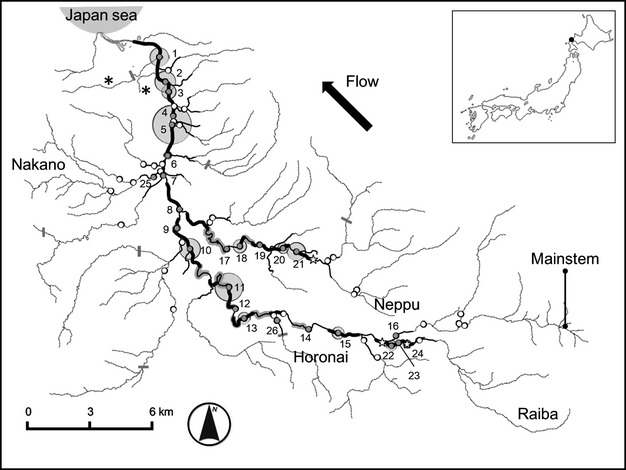
Figure 2.

Map of the Shubuto River system. Filled and open plots indicate sampling sites with and without mussels, respectively. The size of bubbles is proportional to the settled subpopulation size (range: 1–792 mussels per site). Numbers by filled plots indicate the subpopulation ID (see also Fig. 3). Reaches (0.5 km) with reproductive subpopulations are shown in thick black lines. Thin black lines represent the distribution range of potential immigrants estimated from host fish dispersal. Stars indicate the upstream range limits of reproductive subpopulations in each river. Gray-shaded river lines indicate river sections that were inaccessible during spatially continuous surveys. Thick gray lines crossing rivers represent river-crossing structures preventing dispersal of Oncorhynchus masou masou. Note that the Yunosawa and Mitsutaki streams (asterisks) were excluded from the distribution range of potential immigrants.
