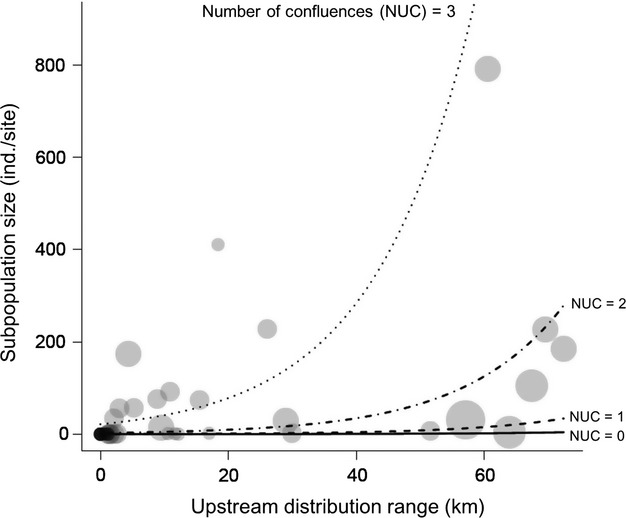
Figure 4.

Strong positive effects of the upstream distribution range (UDR) of potential immigrants and the number of upstream confluences (NUC) on Margaritifera laevis subpopulation size. Solid, broken, broken-dotted, and dotted lines (NUC = 0, 1, 2, and 3, respectively) indicate predicted values from the best model (GLMM with negative binomial error distribution) explaining the subpopulation size. Gray bubbles indicate observed values of subpopulation size, and the size of bubbles is proportional to the NUC. The values of all predictors except the UDR and NUC are fixed at their median values to isolate the partial contribution of these variables to the response variable.
