
Figure 5.
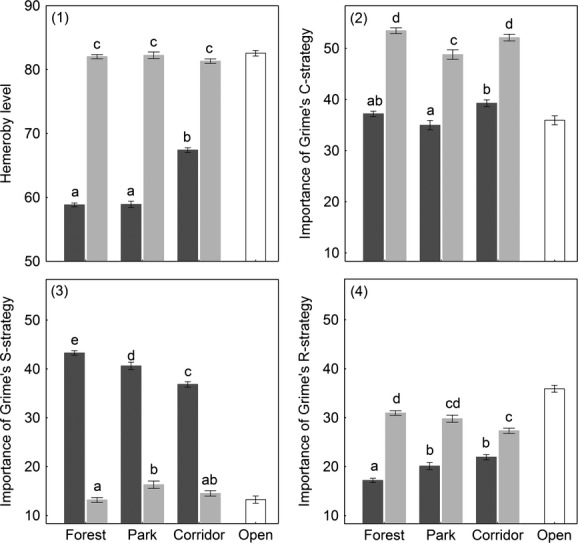
Life-strategy trait patterns per species group across habitat types (means ± standard errors). Different letters within a figure indicate a significant pairwise difference (Tukey's post hoc test, P < 0.05). Bar coloration represents species group (forest specialists = dark gray; corridor specialists = light gray; open habitat specialists = open bars).