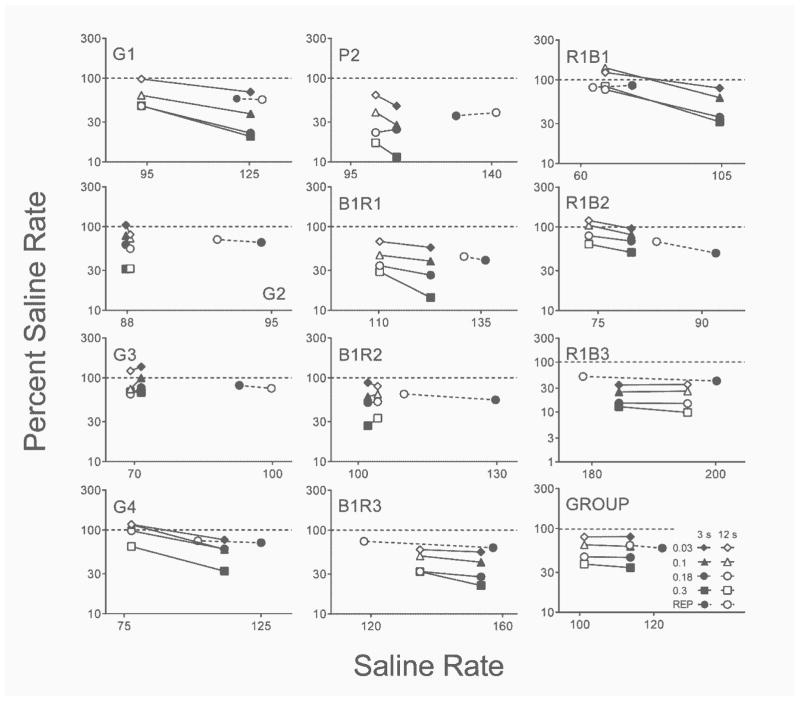
Fig. 6.
Individual-subject and group mean local response rate (responses per minute; expressed as percent saline rate) in initial links corresponding to 3 s (closed symbols) and 12 s (open symbols) terminal-link delays as a function of local response rate in saline sessions in the acute (solid lines) and repeated (dashed lines) PPX assessments in Experiment 1. The horizontal dashed lines indicate no change from saline performance. Log–log axes are scaled differently to optimize presentation for each subject. REP = repeated PPX assessment.

