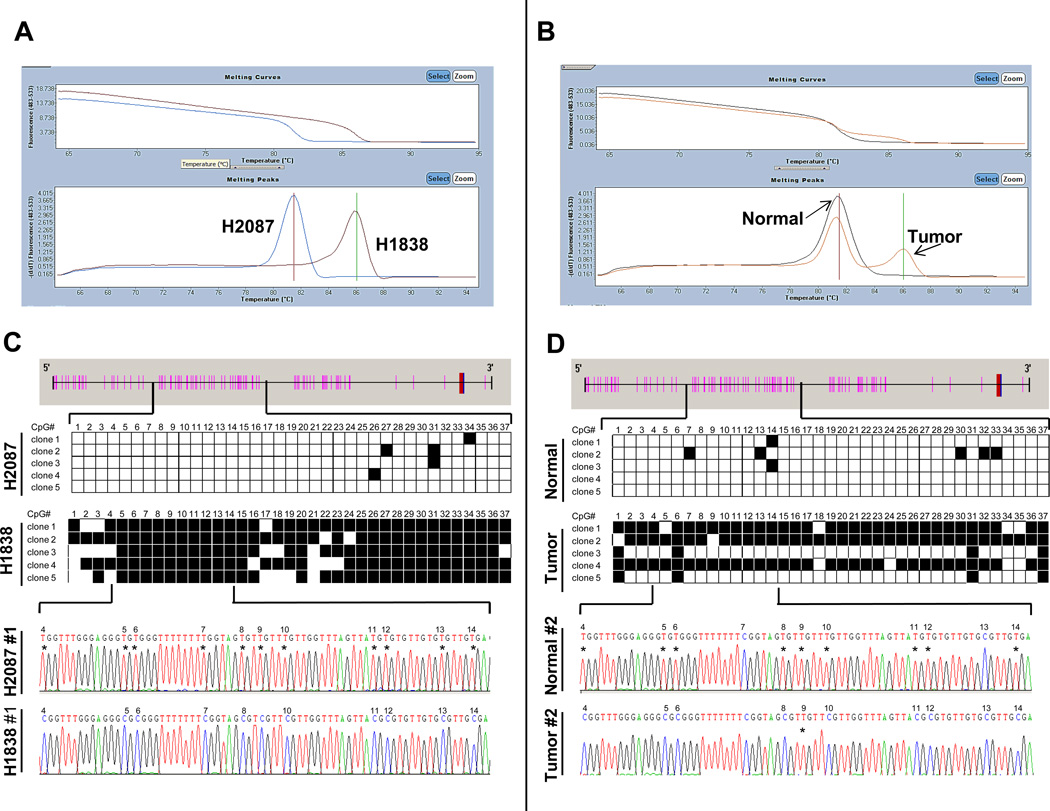
Figure 1.
Methylation status of miR-34b/c in lung AC cell lines and primary tumors. (A and B) Representative examples of qRT-PCR dissociation analysis (melting curve analysis, MCA) for miR-34b/c. Melting curves and derivative peaks from two cell lines (H2087 and H1838) are shown in the left panel (A) and from a lung AC and its corresponding nonmalignant lung tissue in the right panel (B). Curves were separated according to the level of methylation and an outstanding difference in the melting temperature between unmethylated and methylated samples was observed. The melting peak of lung AC tumor showed a bimodal pattern representing the unmethylated alleles that may correspond to the stroma present in the tumoral sample (<30%). (C and D) Results and representative chromatograms from bisulfite genomic sequencing (BGS) of the miR-34b/c promoter. CpG sites are depicted as pink bars and the transcription start sites as blue bars. Five clones of each sample were sequenced and each row represents one sequenced allele. Black and white squares represent methylated and unmethylated cytosines at CpG sites, respectively.

