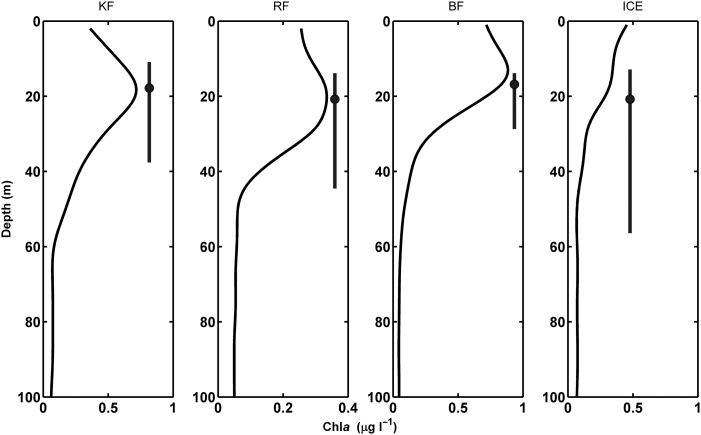
Fig. 3.
Fluorescence profiles measured as Chl a (μg l−1) at each site, Kongsfjorden (KF), Rijpfjorden (RF), Billefjorden (BF) and Ice Station (ICE). In each profile, the vertical extent of the surface SSL at LM is shown by a dark grey vertical line with a dot indicating the depth of the peak Sv within the SSL.

