
FIG 2 .
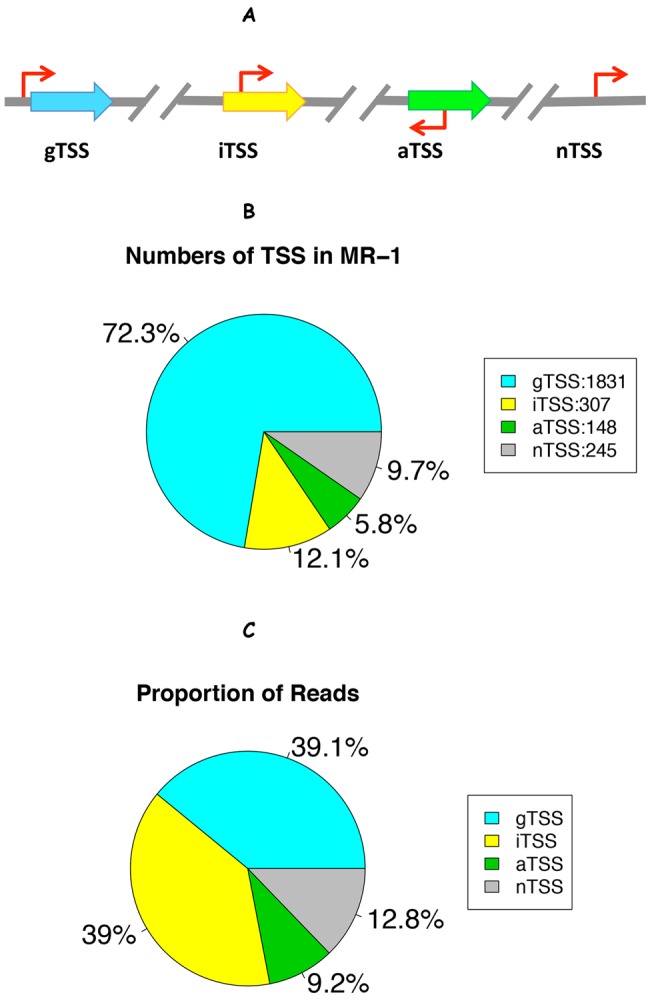
Categorization of Shewanella oneidensis MR-1 TSSs. (A) Schematic illustration of TSS categorization (5): gTSS, within 200-nt regions upstream of an annotated gene; iTSS, inside an annotated gene and on the same strand; aTSS, inside an annotated gene but on the antisense strand; nTSS, in intergenic region and over 200 nt upstream of any annotated gene. (B) The number of high-confidence TSSs (out of 2,531) in each category. (C) The proportion of the total number of 5′ RNA-seq reads whose starts aligned to each category regardless of whether the position was a high-confidence TSS or not (data from minimal medium experiment II).