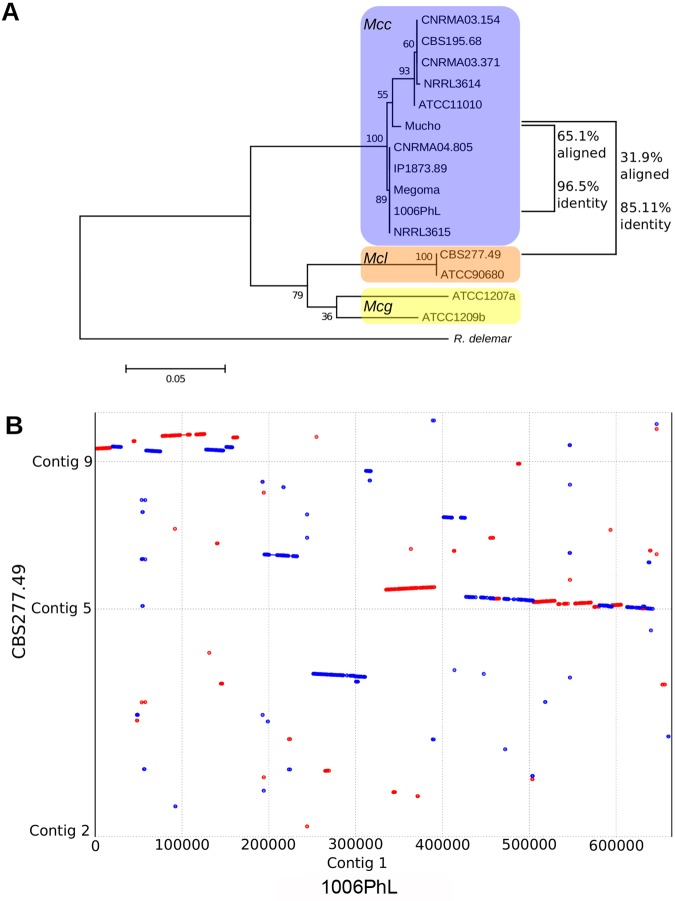
FIG 2 .
Comparison of the Mucho genome to two other M. circinelloides genomes. (A) Maximum likelihood tree of the phylogeny of the Mucor species complex derived from RPB1 with 500 bootstrap replicates. Percentages of coverage and identity between the entire genome of Mucho and each available sequenced genome were determined with Nucmer and are indicated to the right of the tree. Scale bar indicates 0.05 substitutions per nucleotide position (see reference 21 and references therein for the information about the strains used). (B) A dot plot was constructed using Promer and visualized using MUMmerplot. This plot compares the structures of contig 1 of the 1006PhL genome from the M. circinelloides f. circinelloides group and contigs of the more distant M. circinelloides f. lusitanicus isolate CBS277.49. A similar result was obtained when Mucho contig 1, mapped based on contig 1 of the 1006PhL genome, was compared to the CBS277.49 genome. Red indicates alignment in the forward direction, while blue indicates alignment in the reverse direction.

