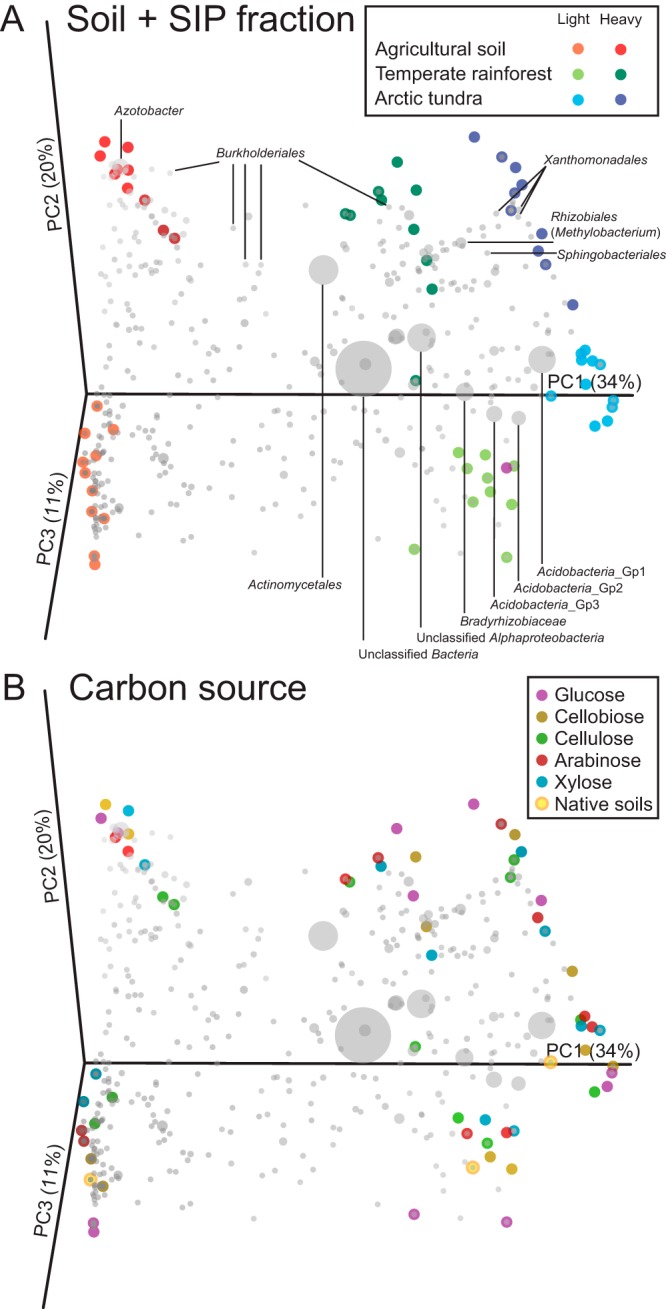
FIG 2 .

Principal coordinate analysis (PCoA) biplots of weighted UniFrac distances for 16S rRNA gene sequences generated by assembled paired-end Illumina reads. Samples separated by soil type and fraction (A) as well as by carbon source (B). Native soils were associated with their respective light fractions. Gray spheres represent taxonomic affiliations of OTUs that correlated most strongly within the ordination space.
