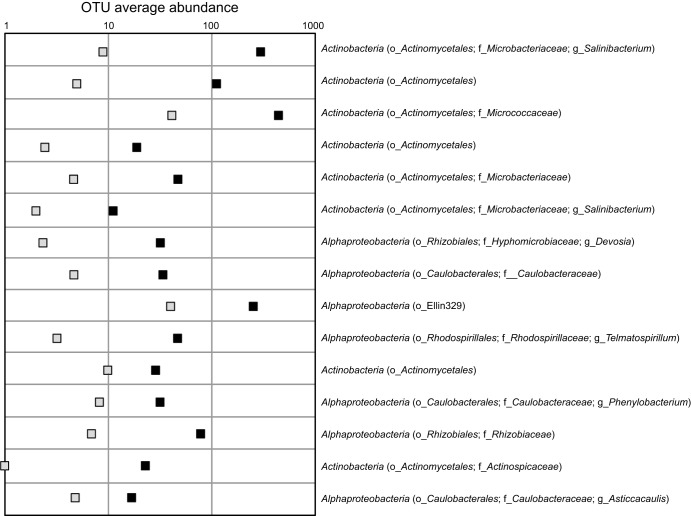
FIG 3 .
Cleveland plot of operational taxonomic unit (OTU) abundance for OTUs possessing the highest indicator values (i.e., >70%) for an association with DNA-SIP heavy DNA (black squares [average abundance]) for all substrates and soils combined, in comparison to light DNA (gray squares [average abundance]). Taxonomic affiliations are included for phyla, with additional classifications for order (o_), family (f_), and genus (g_). For additional details, see Table S1 in the supplemental material.

