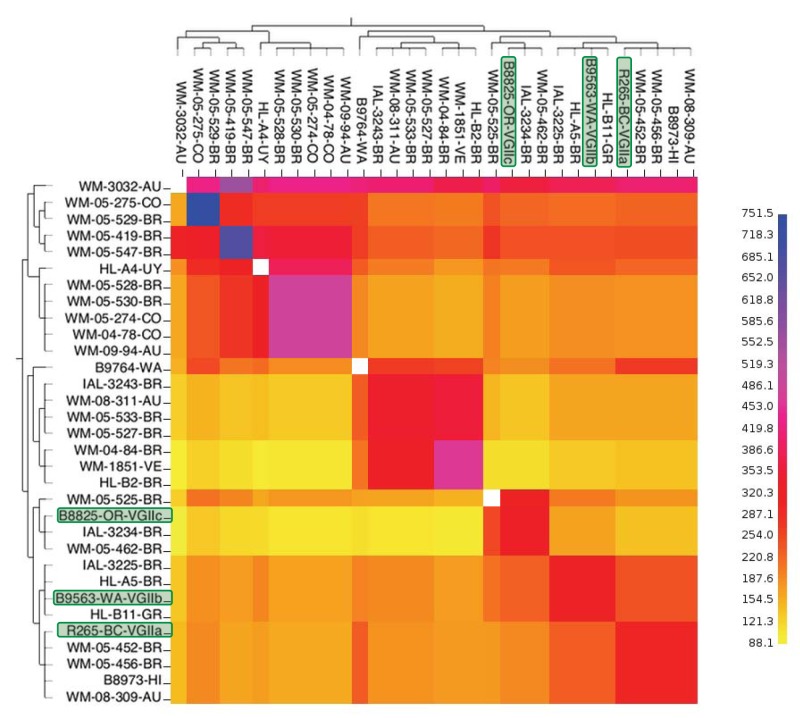
FIG 6 .
fineStructure analysis of dominant VGII subtypes. To identify the population structure and possible recombination events within VGII, fineStructure analysis was performed using the SNP matrix developed for Fig. 2. Using one representative from each of the 32 VGII subtypes, whole-genome SNP data were reduced to a pairwise similarity matrix. The population structure is identified using this similarity matrix, where the underlying model assumes individuals within populations will share more regions of their genome with each other and have a similar amount of admixture with individuals from different populations. Identified populations are merged one at a time, at each step using the most likely population merge, to relate populations to each other through a tree. The x-axis analysis represents the strain as a “recipient,” and the y axis represents the strain as a “donor” of genomic regions. The scale bar represents the number of shared genome regions with blue being the greatest amount of sharing and yellow being the least. The PNW-associated subtype representatives are outlined in green.

