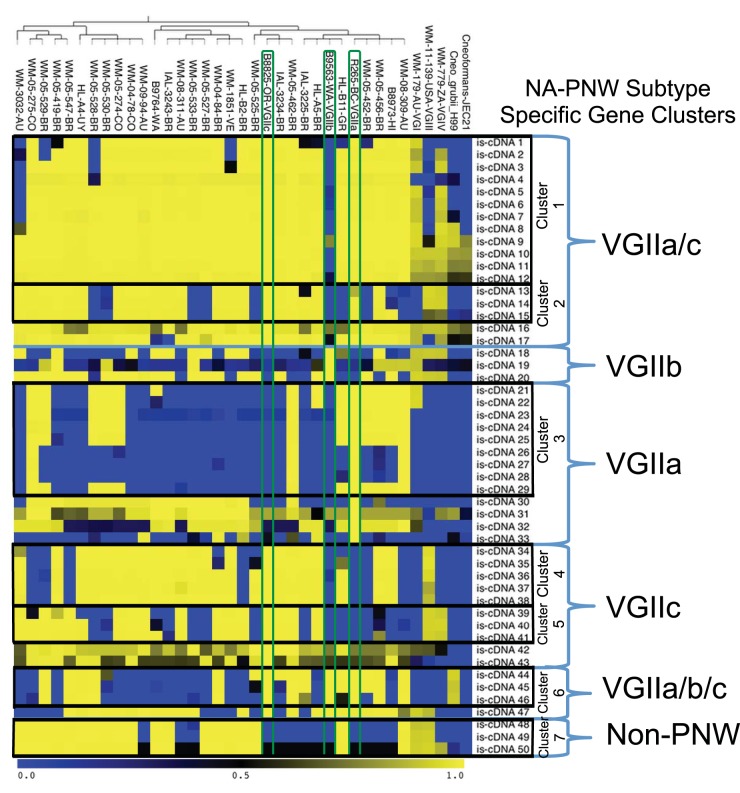
FIG 7 .
Population-level gene content analysis. To identify shared and differing gene content between and among the PNW subtypes compared to other VGII subtypes, other C. gattii molecular types, and other Cryptococcus species, BLAT score ratio analysis was performed, which is described in detail in the Materials and Methods. The genomes scored are the same as in Fig. 6 plus one representative each from VGI, VGIII, VGIV, C. neoformans var. neoformans, and C. neoformans var. grubii. VGII isolates are presented in the populations identified by fineStructure analysis where the tree on top is reproduced from Fig. 6. The rows on the left are divided by comparison group (VGIIa only, VGIIa and VGIIc only, etc.); these rows are further grouped by identified contiguous gene clusters (clusters 1 to 7). Genes of high homology between groups are yellow (complete homology = 1.0 on the heat map bar), and no homology (complete absence of the scored gene = 0.0) is represented by blue, with intermediate colors representing a gradient of similarity. The PNW population representatives and their scores are outlined in green.

