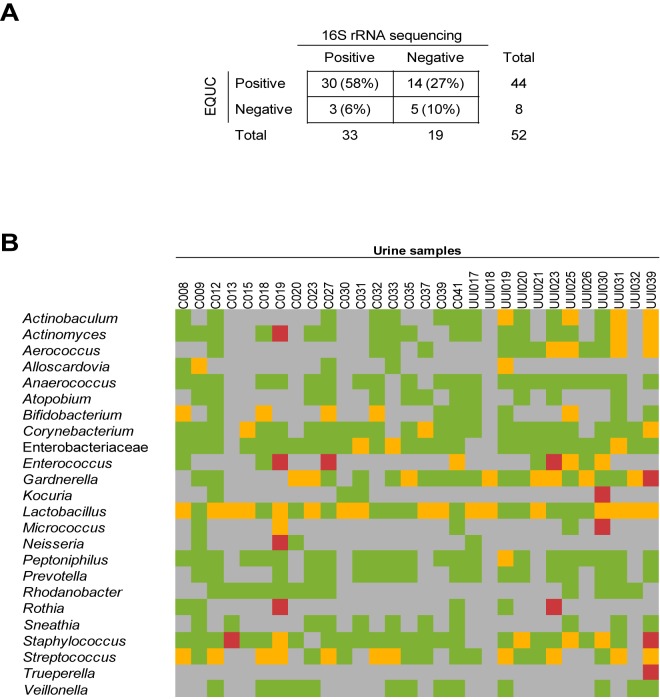
FIG 7 .
Comparison of taxa detected by 16S rRNA gene sequencing and EQUC. (A) Comparison of sequence status and EQUC status for the 52 urine samples that were assayed by both methods. (B) Comparison of the taxa detected by sequencing and culture of the sequence-positive, EQUC-positive urine samples (n = 30). Each square was color coded based on whether the taxa were detected by sequence only (green), EQUC only (red), sequence and EQUC (yellow), or neither sequence nor EQUC (gray).

