
FIG 1 .
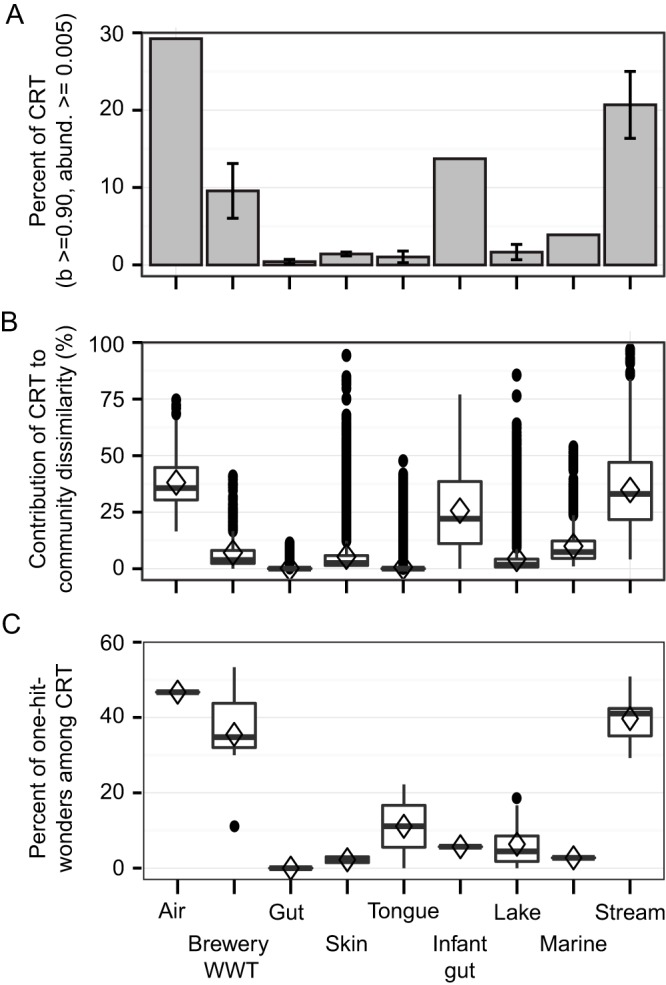
Incidences of CRT and their contributions to community dissimilarity. (A) Incidences of CRT across different ecosystems. Error bars are standard deviations of the means, but none are reported when n = 1 time series. (B) Fraction of temporal community dissimilarity attributed to the dynamics of CRT. Each open diamond is the mean of an ecosystem, whiskers are the lower and upper quartiles, and closed circles show outliers. b value, >0.90; relative abundance, >0.5%. (C) CRT observed only once in a time series, when blooming (one-hit wonders). WWT, wastewater treatment.