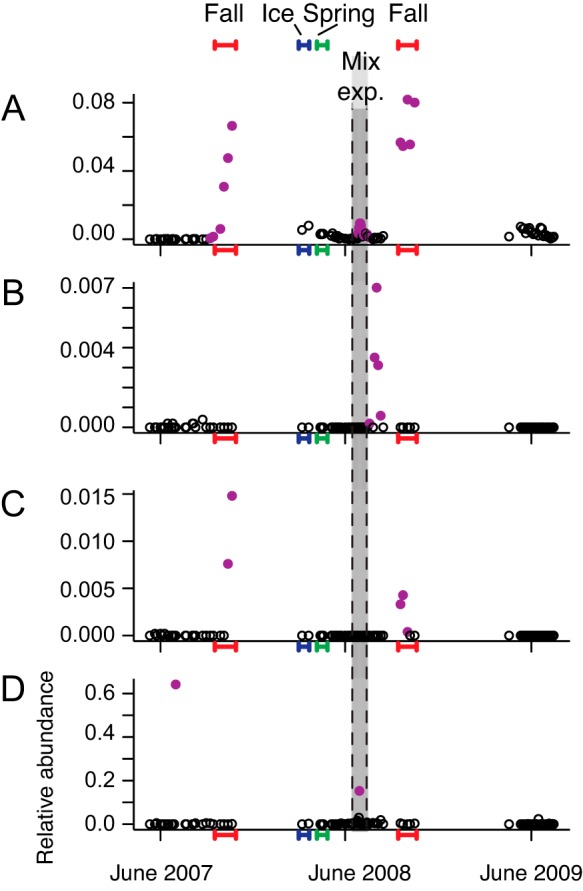
FIG 4 .

Representative dynamics of CRT from the North Sparkling Bog hypolimnion, observed over three ice-free seasons (2007 to 2009) that included a whole-ecosystem mixing experiment in July 2008 (shaded in gray, between dashed lines). Bloom events are purple points. Samples collected during fall mixing are underlined in red on the x axis, those collected during spring mixing are underlined in green, and those collected under ice are underlined in blue. A, Sphingobacteriales OTU 70346; B, Haliangiaceae OTU 333636; C, Flavobacterium OTU 426108; D, Moraxellaceae OTU 584176. Note the differences in y axis ranges.
