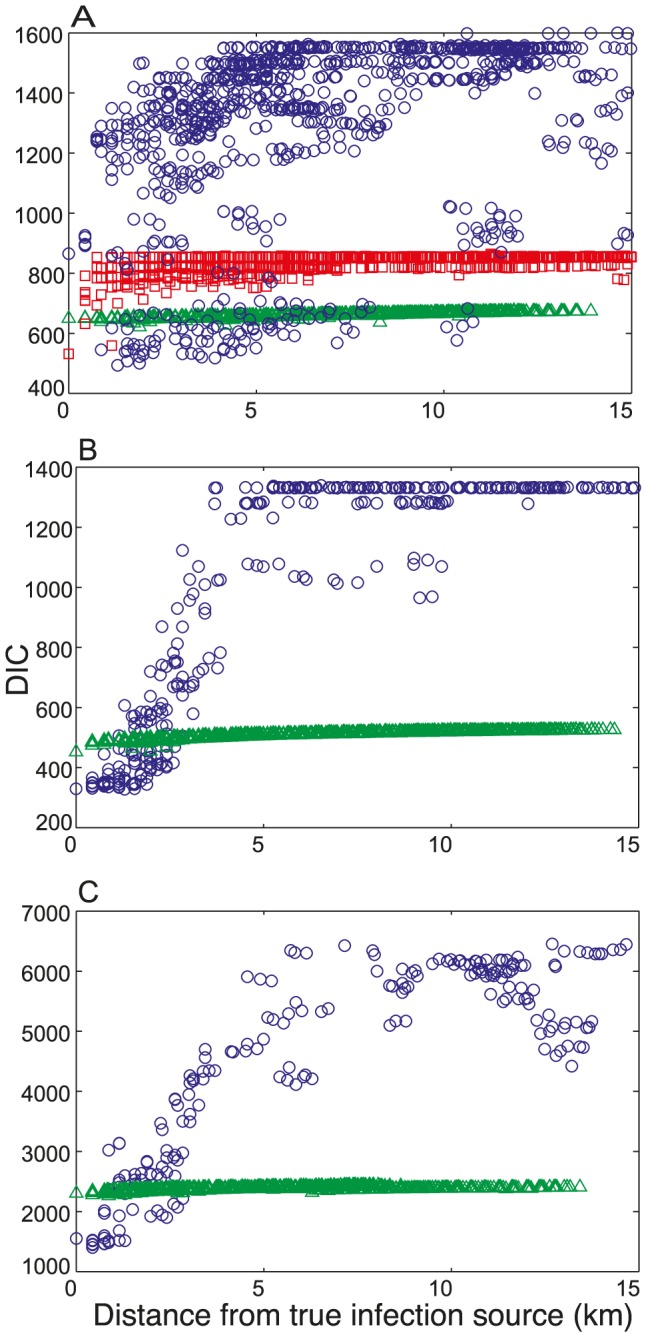
Figure 3. The DIC value for different locations of the infection source for the outbreaks in A. Stoke-on-Trent, B. Hereford and C. Barrow-in-Furness.

The three levels of richness of the human movement data are shown: Level 1 (red squares), Level 2 (blue circles) and Level 3 (green triangles).
