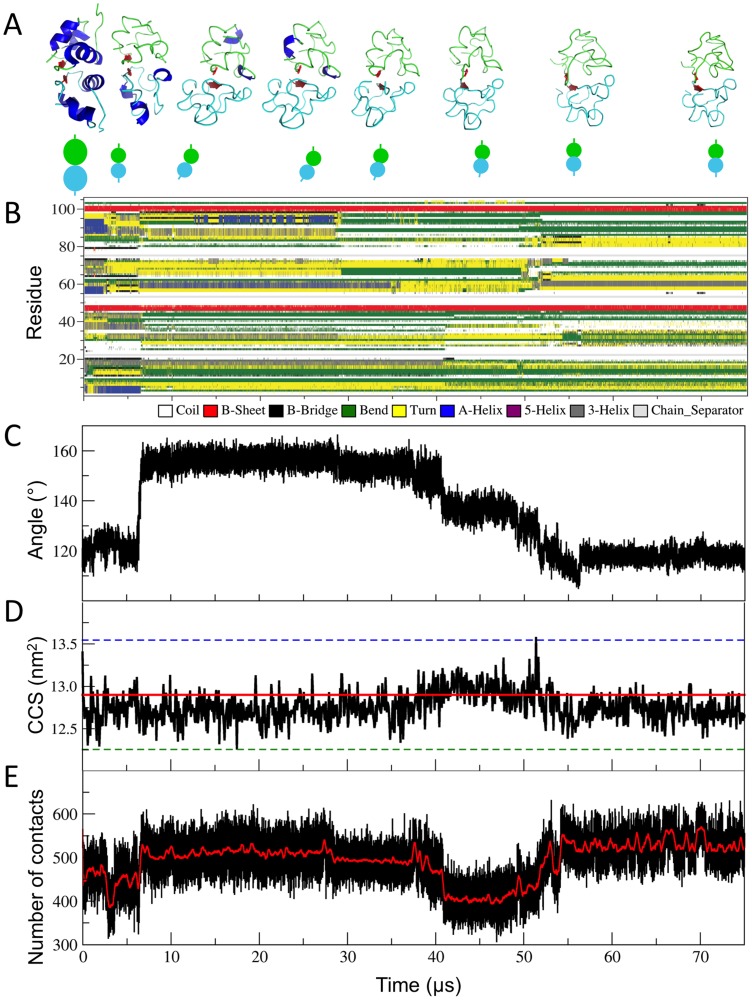
Figure 3. MD simulations in the gas phase of the [hIns2]6+.
(A) Models of [hIns2]6+ obtained from MD simulations in the gas phase (from left to right, at 0 µs, 5.7 µs, 8.1 µs, 27.6 µs, 36.3 µs, 42.6 µs, 54.9 µs, and 75.0 µs). The monomer I and II are indicated in cyan (lower structure) and green (upper structure), respectively. The α-helices and β-sheets are highlighted in blue and red, respectively. Schematic representations of the complex models are shown below the complex structures, at corresponding positions on the simulation time axis. The backbone RMSD values of the models in respect to the one at 0 µs are 0.25 nm (5.7 µs), 0.54 nm (8.1 µs), 0.55 nm (27.6 µs), 0.49 nm (36.3 µs), 0.45 nm (42.6 µs), and 0.49 nm (54.9 µs), and 0.50 (75.0 µs). (B) Secondary structure analysis for [hIns2]6+. (C) The angle between the center of mass (COM) of monomer I – β-sheet region – monomer II. (D) CCS values. The experimental value of 12.9 nm2, as reported [52], at the main charge state is indicated by a red solid line and its 5% variations are indicated by the dashed lines. The average value from our MD simulation in the gas phase is 12.8±0.2 nm2. (E) Number of contact pairs between the carbon atoms of the monomers within 0.60 nm.

