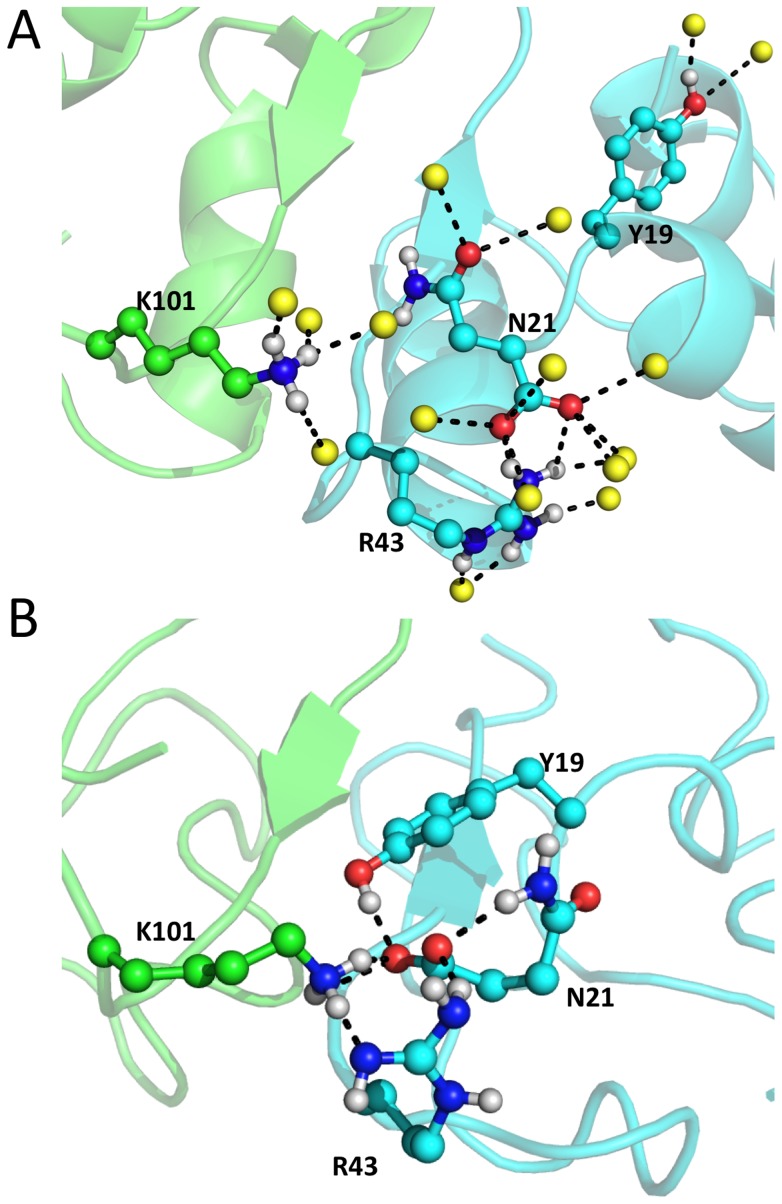
Figure 4. Comparison of a local inter- and intra-molecular hydrogen bond network in water (A) and in the gas phase (B).
The final snapshots obtained from the MD simulations in water and in the gas phase at the main charge were selected. The monomer I and II are indicated in cyan and green, respectively. The water oxygen atoms are indicated by yellow balls. Nitrogen, dark blue; oxygen, red; hydrogen, white. Hydrogen bonds are shown as dashed lines.

