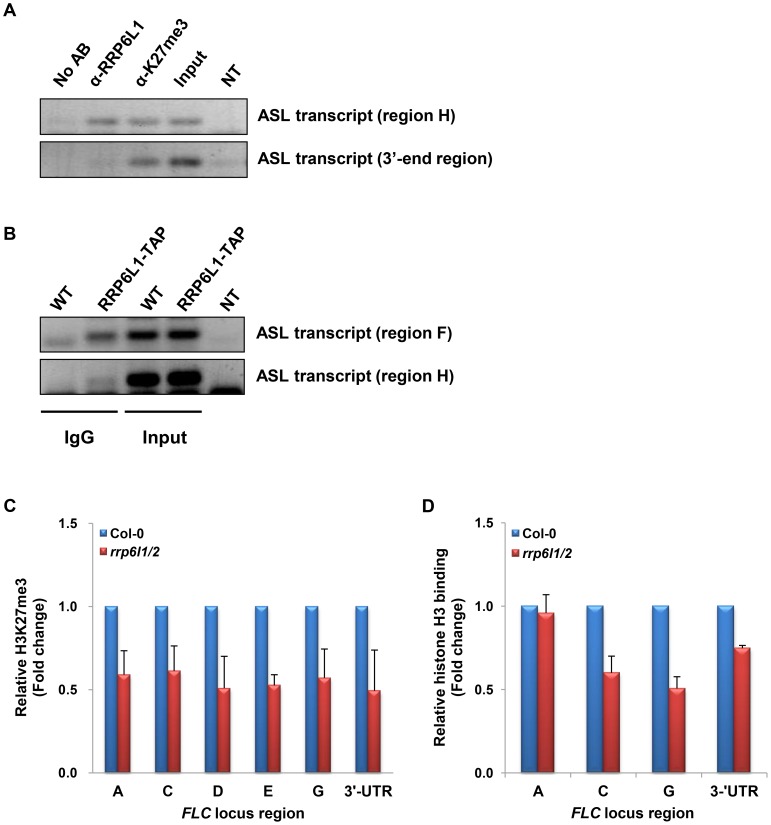
Figure 5. ASL transcript associates with AtRRP6L1 protein and H3K27 trimethylated regions and rrp6l1/2 mutants have decreased H3K27me3 and nucleosome density.
(A) ASL transcript directly associates with AtRRP6L1 protein and H3K27me3 regions of FLC. RNA-IP was performed using anti-AtRRP6L1 and anti-H3K27me3 antibodies to precipitate ASL RNA from wild type Col-0 plants. The regions used in RT-PCR (region H and the 3′end of ASL) are shown on Fig. 3A. No AB indicates no antibodies and is the negative control for RNA-IP. NT indicates no template and is the negative control for RT-PCR. (B) ASL transcript directly associates with AtRRP6L1 in rrp6l1-3 mutants complemented by functional AtRRP6L1-TAP transgene. Transgenic plants are in the Ws ecotype and Ws was used as negative control for RNA-IP. RNA-IP was performed using IgG antibodies to co-precipitate ASL RNA with RP6L1-TAP from wild type plants complemented with a transgene expressing RRP6L1-TAP. NT indicates no template and is the negative control for RT-PCR. (C) The level of H3K27me3 is decreased in rrp6l1/2 mutants. ChIP assays were performed using H3K27me3 antibodies. The level of H3K27me3 in rrp6l1/2 mutants was plotted relative to the level of H3K27me3 in Col-0 plants. The error bars in ChIP experiments represent the standard error of the mean and correspond to the difference between 2 biological replicates. (D) Nucleosome density is decreased in rrp6l1/2 mutants. Mnase-ChIP assays were performed using histone H3 antibodies. Nucleosomal density in rrp6l1/2 mutants was plotted relative to the level of nucleosomal density in Col-0 plants. The error bars in ChIP experiments represent the standard error of the mean and correspond to the difference between 2 biological replicates.

