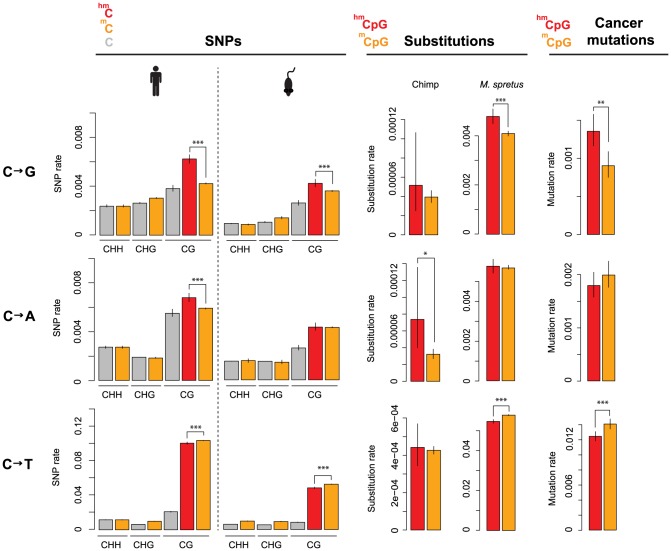
Figure 1. Evolutionary rates differ according to methylation state.
Rates of cytosine loss are given as a function of methylation status (5hmC: red; 5mC: orange; C: grey), methylation context (CHH, CHG, CG; H = A/C/T) and evolutionary event (derived SNPs in human or mouse population; substitutions along the chimp or M. spretus lineage; somatic mutations in cancer genomes). Only significant differences between 5hmC and 5mC sites in a CpG context are highlighted (***P<0.001; **P<0.01; *P<0.05). Error bars are 95% confidence intervals, calculated using Wilson's interval score for single proportions.

