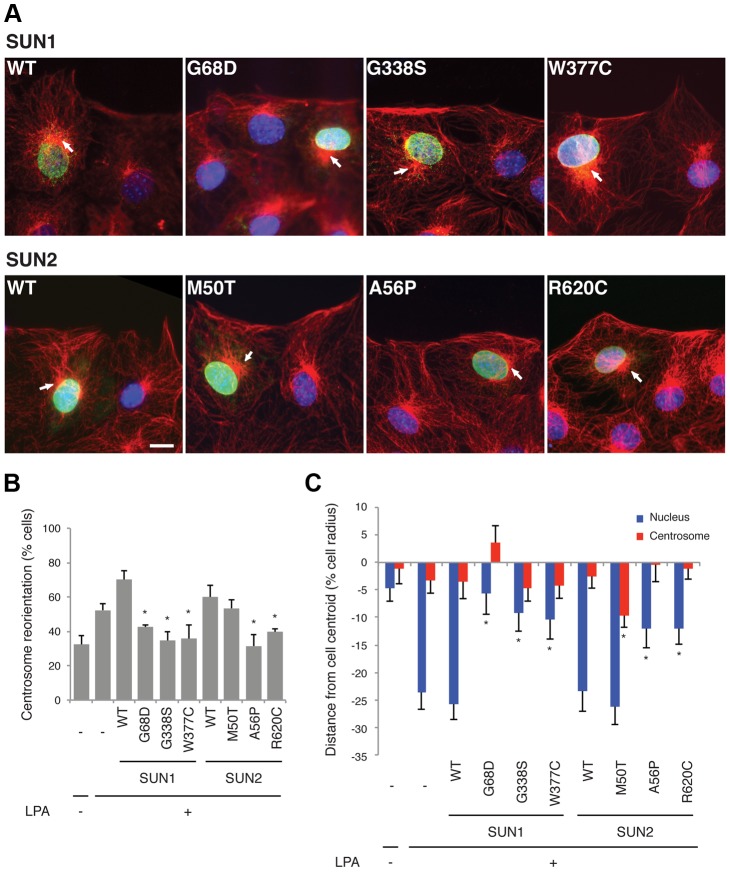
Figure 2. SUN1 and SUN2 variants disrupt nuclear-cytoskeletal coupling in NIH3T3 fibroblasts.
(A) Representative immunofluorescence micrographs of LPA-stimulated NIH3T3 fibroblasts expressing SUN1 or SUN2 wild-type (WT) or variant proteins. Cells were immunostained for myc (green), tubulin (red) and DAPI (blue). Location of centrosome (arrows) was determined by the center of microtubule array. Bar, 20 µm. (B) Quantification of centrosome reorientation in LPA-stimulated NIH3T3 fibroblasts expressing the indicated SUN variants. Significant differences are indicated by * with α<0.05 based on Student's t-test when the sample is compared to non-expressing NIH3T3 fibroblasts. (C) Quantification of nucleus and centrosome position relative to the cell centroid in NIH3T3 fibroblasts expressing the indicated SUN variants. Positive values are toward the leading edge, negative values toward the cell rear. Data are from at least three independent experiments for each sample. Significant differences are indicated by * with α<0.05 based on Student's t-test when the sample is compared to non-expressing NIH3T3 fibroblasts.

