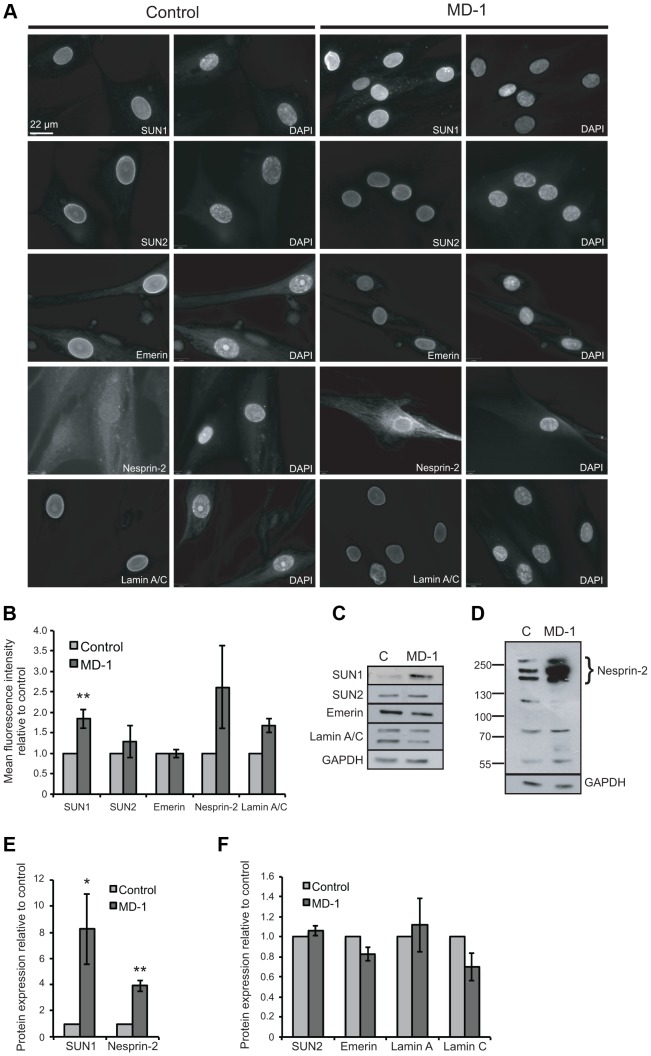
Figure 3. Expression of LINC complex proteins is increased in patient MD-1 (SUN1 p.G68D/p.G338S) myoblasts.
(A) Control and MD-1 myoblasts were fixed in methanol and analysed by immunofluorescence microscopy using SUN1, SUN2, emerin, nesprin-2G and lamin A/C antibodies, as indicated, together with DAPI staining of DNA. Scale bar, 22 µm. (B) Mean fluorescence intensity of SUN1, SUN2, emerin, nesprin 2 and lamin A/C was measured in individual DAPI-stained nuclei using an Olympus Scan∧R screening station and analysed using Scan∧R analysis software. The results are presented as mean ± S.E. of 1000 cells taken from at least 3 independent experiments. **P≤0.05. Significant P-value for SUN1 was P = 0.009. (C) Total protein extracts from control (C) and patient MD-1 myoblasts were Western blotted using antibodies against LINC complex-associated proteins, as indicated. (D) Samples prepared as in A were Western blotted using nesprin-2 (N2–N3) antibodies. (E–F) Protein expression was quantified by densitometric analysis of at least 3 independent experiments. The results are presented as mean ± S.E. *P≤0.05 and **P≤0.01. Each significant P- values are as follows: SUN1 P = 0.05, α-tubulin P = 0.003, nesprin-2 P = 0.002. P- value for emerin was P = 0.06.

